A Minimum Income Standard for the United Kingdom in 2024
The Minimum Income Standard is a vision of the living standards that we, as a society, agree everyone in the UK should meet.
This report from the Centre for Research in Social Policy (CRSP) at Loughborough University sets out what households need to reach it in 2024.
- Key points
- 1. Introduction
- 2. Rebasing MIS in 2024 – methodology
- 3. Rebasing MIS in 2024 – qualitative findings
- 4. MIS budgets in 2024
- 5. How MIS compares with incomes on benefits and the National Living Wage
- 6. Conclusion
- Notes
- Annex: MIS in brief
- References
- Acknowledgements
- About the authors
- How to cite this report
Key points
Despite the challenges of the past few years, including the cost of living crisis, this report shows that people still think that everyone should be able to do more than merely survive. Meeting basic needs alone is not enough for people to thrive. They need to be able to connect with others, have choices and opportunities and feel included in society. For many people in the United Kingdom (UK), there continues to be a gap between what they have and what they need for a decent standard of living.
Indeed, more people are falling well short of a Minimum Income Standard (MIS), including many who are working. Reporting findings from April 2024, this research provides a picture of what people agreed a minimum socially acceptable standard would enable people to have and do. Future updates will help to assess whether the new government’s objective to improve living standards has enabled more people to meet their needs.
Here are the key points from the report:
- MIS continues to provide a unique and distinctive way through which to observe and track the impact of social, economic, political and cultural change on our shared vision for higher living standards, so we can all live with dignity in the UK.
- In 2024, we have rebased (that is, developed from scratch) budgets for all households in the same year, for the first time since MIS was introduced in 2008.
- Working-age households (both with and without children) have identified a need for additional financial resources to meet health needs, reflecting the difficulty of accessing help via the National Health Service (NHS).
- A single person needs to earn £28,000 a year to reach a minimum acceptable standard of living in 2024. A couple with 2 children need to earn £69,400 a year between them.
- April 2024 saw an inflation-based increase in benefits of 6.7%. However, Council Tax, water and broadband prices all rose in April.
- The final cost of living payments, intended to help those households most likely to be affected by rising costs, were made in February 2024, with no announcements of further support being planned.
- Without these payments, working households may struggle to meet the challenges posed by inflation, even though that fell between May 2023 and April 2024 and is forecast to reach 2% in the second half of 2024.
- Despite this, a couple with 2 children, where one parent is working full-time on the National Living Wage, and the other is not working, reached only 66% of MIS in 2024, compared with 74% in 2023.
1. Introduction
Since 2008, Minimum Income Standard (MIS) research has provided a living standards benchmark. It sets out what the public agree is needed to live in dignity and the income required to meet this standard. As a data series it provides a basis for monitoring how many people are falling below, and how far below, this level (Padley et al., 2024).
This MIS report reflects public consensus on what is needed for a dignified socially acceptable standard of living in 2024, developed from group discussions held between May 2023 and March 2024. It is rooted in what people were experiencing at that time and what resources and priorities were considered important for households to be able to thrive, with all items priced in April 2024. Over much of the fieldwork period, food and fuel prices remained high, and the cost of living crisis continued to contribute to an ongoing sense of uncertainty.
Following the general election of 4 July 2024 there has been a new focus on improving living standards, with bills introduced in the King’s Speech relating to children’s wellbeing, renters’ rights, domestic fuel, public transport and mental health, among many others. This year’s MIS report provides a valuable point of comparison, not just with previous years but also as a pre-Labour government baseline. Over the following years, MIS research will help to assess what progress has been made, and continue to inform public and political discussions about what kind of society we want to live in, and how we might get there.
MIS establishes a threshold below which the public agree no one should fall if they are to meet their minimum needs and participate fully in society. This report draws on more than 130 hours of discussion with members of the public held throughout the UK from May 2023 to March 2024. These deliberative groups of parents, pensioners and people without dependent children came together to decide what is needed to meet a minimum socially acceptable standard. This standard includes material needs such as housing, clothing, food, furniture, toiletries and other household goods, and more intangible needs, such as communication, connection and social interaction.
Update schedule
Up to 2024, we updated MIS on a rolling programme, alternating between conducting new primary research in one year and uprating the budgets by inflation in the next. New participants were involved in the primary research every 2 years, keeping MIS relevant to today’s society.
Since 2012 we have been combining review (where we convene new groups to assess existing lists to find out what has changed since the last research) with rebasing (starting from scratch), alternating households with and without children in each process, with inflation uprating in between years (see Table 1 for details from 2020 to 2023).
| 2020 | 2021 | 2022 | 2023 | |
|---|---|---|---|---|
| Households without children | Review | Inflation uprating | Rebase | Inflation uprating |
| Families with children | Rebase | Inflation uprating | Review | Inflation uprating |
From our previous MIS work, we could see that during prolonged periods of economic uncertainty and instability there was a risk that continuing to rebase the budgets at different times would make it increasingly difficult to get a clear picture of how living standards were changing for and across all demographic groups. For these reasons, the 2024 update became a full rebase across all households – the first time that all household budgets have been rebased within the same year since the first MIS report was published in 2008. This represents a new landmark in the MIS series, giving an opportunity to reflect more widely on what the public think is needed for a minimum socially acceptable standard of living in the contemporary UK.
The MIS updating cycle has therefore changed so that it continues to provide comprehensive new research across all household types every 2 years, but with a different structure to previously. In odd-numbered years, MIS budgets will continue to be uprated by inflation, applying changes in broad categories of the Consumer Prices Index (food, clothing and so on) to the MIS budget categories. Every 2 years (even-numbered years), as before, all budgets will be subject to new primary research, alternating between review and rebase (see Table 2). A MIS review asks groups to confirm or amend existing budget lists, but only changes items where there is a clear consensus and rationale for doing so, in other cases continuing to uprate with inflation. Rebasing of MIS budgets, on the other hand, is a much more exhaustive and in-depth exercise, repeating the original research and pricing items from scratch.
| 2024 | 2025 | 2026 | 2027 | 2028 | |
|---|---|---|---|---|---|
| Households without children | Rebase | Inflation uprating | Review | Inflation uprating | Rebase |
| Families with children | Rebase | Inflation uprating | Review | Inflation uprating | Rebase |
2. Rebasing MIS in 2024 – methodology
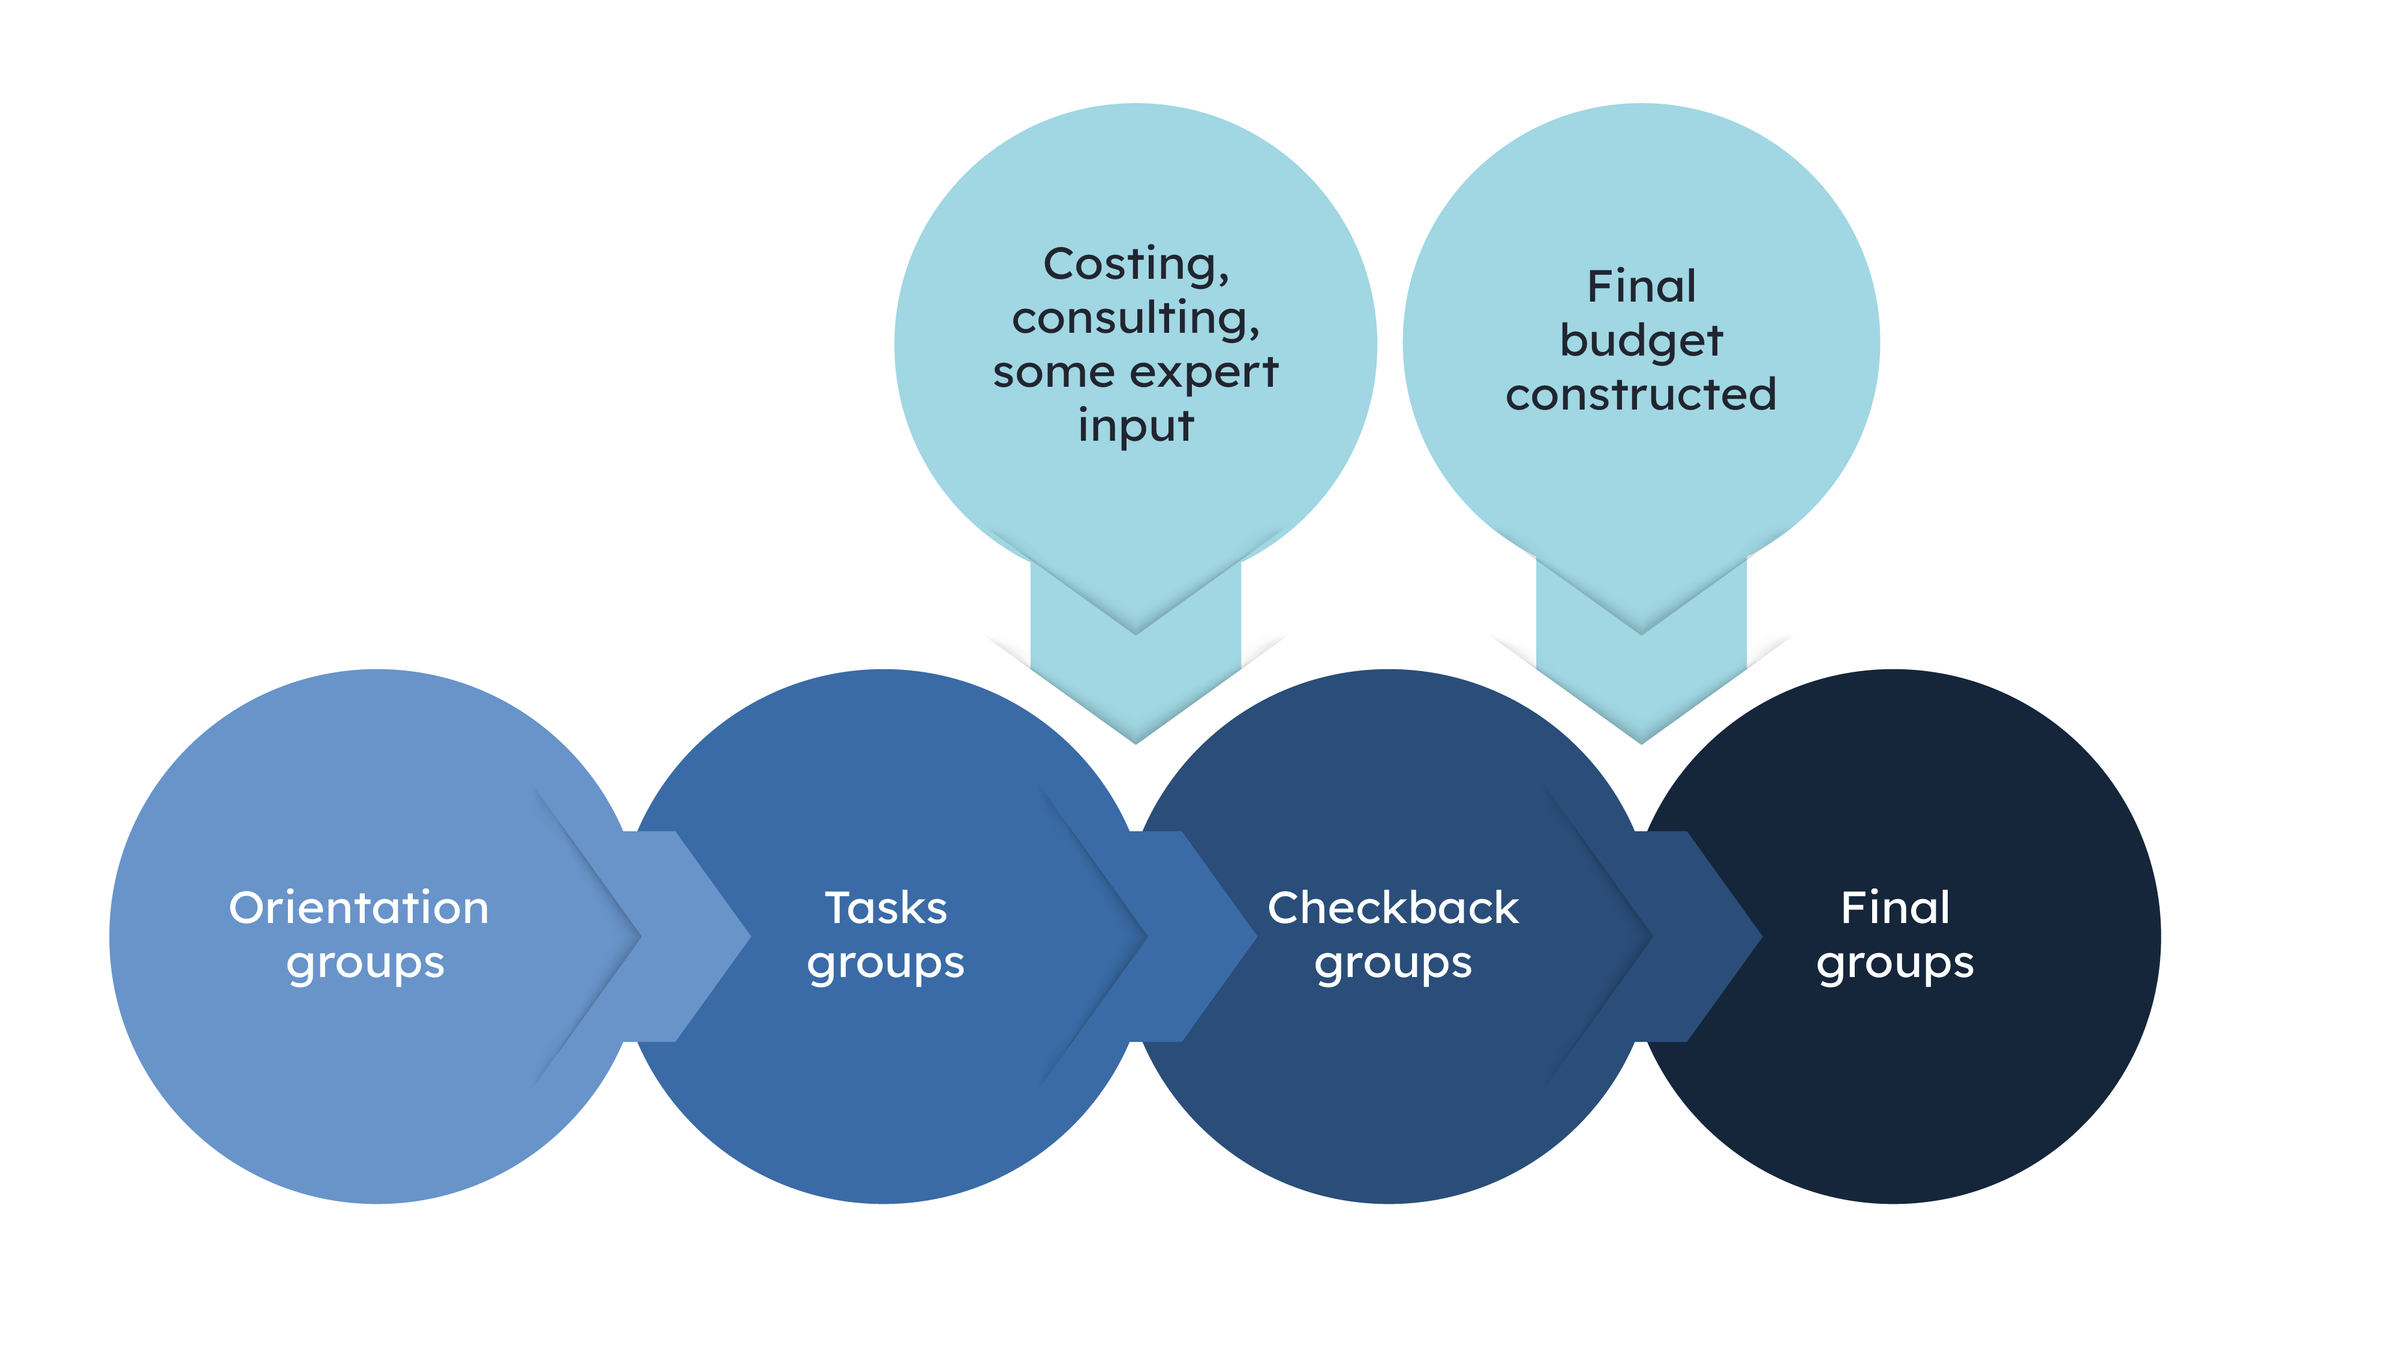
Rebasing centres around a succession of discussion groups with the general public, using the case studies and the definition of a minimum acceptable standard of living that groups established in 2006. As in all previous MIS research, each group is asked to consider what goods and services someone needs in order to have a minimum acceptable standard of living.
Groups are held in stages:
- orientation groups
- task groups
- checkback groups
- final groups.
Group members are drawn from the family types and individuals under discussion in each case. At each stage, a new set of participants are recruited for the groups. At various points before and after these ‘general public’ groups, ‘expert professionals’ are consulted to provide input to specific areas of the budgets (chiefly domestic energy and nutrition). Figure 1 sets out the stages in the MIS process.
3. Rebasing MIS in 2024 – qualitative findings
The rebase groups are of different durations depending on the function of the group. The first-stage groups (orientation groups) are 2 hours long and are used to check some key principles, particularly relating to housing, transport and, in the case of households with children, childcare. Decisions from these groups affect the assumptions used in groups regarding the size and tenure of housing for different household types, and inform subsequent conversations around transport and (where relevant) childcare.
The task groups each spend 6 hours discussing the needs of a case study individual (that is, a made-up example of someone from the same demographic group as the participants). In groups looking at the needs of children of particular ages, we talk to parents who have children of the relevant age (that is, infant/toddler, preschool, primary school or secondary school aged children).
All of the discussion groups conducted in MIS research have a deliberative as well as a discursive role. They are convened to negotiate consensus and make detailed decisions relating to the needs of individuals and households. This is achieved by identifying and checking which items to include across 4 waves of groups. In this process, each successive group either corroborates or amends the decisions of previous ones. Groups typically comprise 7 to 10 people from a mixture of socioeconomic backgrounds, but all participants within each group are from the category under discussion. This correspondence between groups and the cases they consider and discuss in demographic terms helps them take on the role of ‘experts by experience’ in the daily needs of those under discussion. For example, a group of parents of preschool children feel well equipped to reflect on what a child of this age group requires.
All groups are audio-recorded and transcribed. The transcripts are used in conjunction with flipcharts, which are annotated during the group discussions to compile the decisions made into lists of goods and services, the retailers these goods and services might be purchased from, the lifespan of all goods and services or how often these need to be replaced, and the quality and quantity of items. The transcripts are thematically analysed and used to illustrate the decision-making processes and discussion points that inform the MIS budget areas presented in each year’s report.
See Table 3a-3d for more detailed information about the composition, number and duration of the groups.
Despite the complexity of recruiting and conducting research in a large number of locations, we continue to hold groups in a greater number of towns and cities across England and in Wales, Scotland and Northern Ireland. This has helped to demonstrate that people’s needs and how they meet them in urban UK do not vary significantly depending on where they live (we know rural communities have additional and different needs relating to how those needs are met), so that MIS continues to be a standard applicable to the whole of the UK.
Stages in the MIS rebase process
| 2 orientation groups |
|---|
| Single and partnered working-age adults without children |
| Mix of lone and partnered parents of children aged under 18 |
| 6 groups of single and partnered working-age adults without children and single and partnered pensioners | 7 groups of lone and partnered parents of children aged under 18 |
|---|---|
| Single working-age men without children | Lone parents |
| Single working-age women without children | Partnered mothers |
| Partnered working-age adults without children | Partnered fathers |
| Single female pensioner | Parents of 0-23 month-olds |
| Single male pensioner | Parents of 2–4-year-olds |
| Partnered pensioners | Parents of primary school children |
| Parents of secondary school children |
| 4 x 2 (8 total) groups of single and partnered working-age adults without children and single and partnered pensioners | 1 x 5 and 1 x 6 (11 total) groups of lone and partnered parents of children aged under 18 |
|---|---|
| Single working-age adults without children (mixed) | Lone parents |
| Partnered working-age adults without children | Partnered parents (mixed) |
| Single pensioners (mixed) | Parents of 0-23 month-olds (Phase 3a) Parents of 2-4 year olds (Phase 3a) Parents of 0-4 year olds (Phase 3b) |
| Partnered pensioners | Parents of primary school children |
| Parents of secondary school children |
| 2 groups, one of single and partnered working-age adults without children, and one of single and partnered pensioners | 2 groups of lone and partnered parents of children aged under 18 |
|---|---|
| Single and partnered working-age adults without children | Lone and partnered parents |
| Single and partnered pensioners | Mix of lone and partnered parents of children aged under 18 |
The social and economic context in which we live affects how much it costs to achieve a minimum acceptable standard of living. The cost of living crisis means that many UK households today face high and rising costs for goods and services, while incomes have not kept up. Continued cuts to public spending and services, welfare retrenchment and labour market challenges have affected household incomes and expenditure. The way that people obtain everyday goods and services has also changed: for example, there has been a notable rise in healthcare borrowing, with UK households using credit packages to self-fund operations and diagnoses, in an attempt to mitigate the challenges of accessing healthcare via an increasingly stretched National Health Service (NHS) (Gabert-Doyon and Quinio, 2024).
Amid these financial challenges are personal costs, with growing health inequalities affecting people across the life course in the UK (Marmot, 2024). However, although MIS does not exist independently of these realities, it is unique in its focus on asking people to think about what a decent living standard is, rather than what people below it might lack. In this way, it differs significantly from other poverty and deprivation-based research and gives us a vision of what people think living in the UK with dignity could and should be like.
This chapter draws on the qualitative data from the deliberative groups in 2024. Much of the ‘basket’ of household goods and services that comprise MIS budgets has stayed the same, which is what we have come to expect over time. A changing economic landscape does not immediately result in a radical rethink among the public about what constitutes a decent living standard.
Living through what seem like particularly precarious times also does not fundamentally change the food people cook and eat and the type of furniture they use in their homes. We continue to check this by carrying out new primary research that includes detailing clothing, toiletries, kitchen equipment and many other everyday household items, and we can see that these kinds of things tend to remain largely similar from one iteration of the MIS research to the next, even though, in some cases, prices may have increased substantially.
Effects can take time to play out, though, as we discovered following the global financial crash in 2008, where subtle changes over the following 9 years’ worth of research pointed at adjusted expectations, availability of services and social and cultural norms (Davis et al., 2018). In 2024 we can see how changes caused by external events and financial pressures affect what people consider to be necessary to reach a minimum socially acceptable standard of living.
Thee remainder of this chapter offers an overview of the contents of the MIS ‘baskets’ arranged by broad category, and summarises the decisions that the deliberative groups made. Decisions to include or exclude particular items are explained in the context of the discussions the groups had and the rationales they used, and how these resonate with evidence from other sources, for example of changes in services, norms and/or consumer behaviour.
The goods and services included in MIS 2024 household budgets are discussed in the following sections:
- housing
- domestic fuel
- food and drink
- clothing
- household goods
- household services
- health and personal care
- transport and travel
- social and cultural participation.
Housing
The first task for groups was to decide what kind of accommodation would be suitable as a minimum for different household types, in terms of tenure (rented or owned) and size (expressed as a flat or a house and the number of bedrooms that occupants need).
As they have done so since the MIS research was first published in 2008, groups unanimously agreed that, as a minimum, rental accommodation would meet households’ needs. Parents agreed that social housing would be acceptable to meet the needs of households with children. It was seen as offering greater stability and security than renting from a private landlord, and there were concerns about the quality of housing stock in the private sector. Major barriers to social housing included the application process itself, lengthy waiting lists, a shortage of suitable properties and reservations about the lack of choice in terms of location.
Research transcript - parents, Sheffield:
Researcher: So, the first question is erm what kind of accommodation would meet their needs as a minimum? In terms of what sector. So do they need to own their own home as a minimum or is that a ‘nice to have’? Is renting OK?
Woman 1: Renting is fine.
Woman 2: Yes.
Woman 3: Social housing.
Woman 1: Social housing… and then private renting is the ‘nice to have’.
Man 1: I must admit, I was listening to the radio the other day, I think social housing sounds better than private… just because of the fact that, well, I say fact, you hear all of these horror stories about mould growing in these private rentals and the council doing nothing.
Woman 2: And also as well, do you know after Covid you’re not very secure in a private rented house anymore. I know so many people now that have been kicked out, well, or just can’t afford to pay the rent anymore because it has gone from £500 to £900 [a month] – it is ridiculous.
[…]
Woman 1: There is long waiting lists [for social housing] and then I think when you eventually get on, you normally get put in an area that you don’t want to be in.
Woman 2: Where you don’t know anyone.
Woman 1: Yes where you don’t know anybody, you have moved away from your family if you have got any up here, and the kids might be at school but then they will have to move schools, that kind of thing, there is quite a lot of disruption.
Woman 3: I don’t think they make it easy. I have not had to do it recently, but I think you have to re-register like every…
Woman 2: Every 2 years I think.
Woman 3: Yes and they go...
Woman 4: No they don’t tell you, because I thought that I was on a list for about 15 years, but it turns out I wasn’t, they cancelled it ages ago, so yes, no they don’t tell you.
Woman 3: So if you have a big waiting time, you haven’t re-registered, you have lost all of your waiting time.
The challenges of accessing social housing have been acknowledged in all the previous waves of MIS research. Perceptions of the precarity and condition of the private rental sector added a new perspective to the discussion this year. They are reflected in analysis from the charity Shelter, showing that no-fault evictions reached an all-time high in 2023 (Shelter, 2024a) and that there was an overall loss of 11,700 social rent homes in 2022–23 (Shelter, 2024b). In addition, the English Housing Survey’s figures from 2021 show that 23% of private rentals did not meet the Decent Homes Standard, compared with 13% of owner-occupied and 10% of social housing (Department for Levelling Up, Housing and Communities, 2022).
Some participants reflected on the difficulties that future generations are likely to face in terms of being able to maintain living standards over time, particularly regarding housing.
Research transcript - parents, Sheffield:
Man 1: I mean I have already told my kids, I think we have got quite a nice house, the kids like it and I have always said to them, I said: ‘You need to get used to the idea you’re not going be able to live in a house like this’ … You know, just about in terms of what is, you know, almost acceptable, I think living standards are going the other way now aren’t they? And I’m not trying to disappoint them, but I am just sort of trying to be pragmatic about what they should expect.
Man 2: We have had that, my mother-in-law, we have had to sell her house to pay for her care, so that for them, you know, actually maybe the kids could have any money from that, but that is gone.
Parents agreed that children should have safe outside space to play in, so they said that a house with a small garden would offer suitable accommodation, rather than a flat. They said that a 2-bedroom house would be adequate for lone or partnered parents with one child, and that families with 2, 3 or 4 children would be able to manage with 3 bedrooms, but that these needed to be of a ‘decent’ size. There were several accounts of older children being ‘squeezed’ into bedrooms that were too small because of the combination of ages and genders among siblings.
Research transcript - parents, Sheffield:
Man 1: No I think you definitely need outdoor… well personally I think you need outdoor space because like I say if we go back to Covid, we were really lucky in that our garden is not big but at least we had got an outdoor space that our kids could go out into. Now if we were in a flat, kids like back then would have been 10/11 or 11 and 12. Now having kids just cooped up in a flat, that would have been a nightmare and there will have been people… there will have been people in that situation. I would have hated to have been in that.
Woman 1: I have been in flats and high rises with mine, on the 6th floor with a lift that doesn’t work and a twin pram, and shopping, sometimes the main door downstairs doesn’t work, the communal area downstairs is not socially acceptable for children to play in because it is used by drug users and alcoholics. [On] the stairs there is a lot of young people on that are smoking and drinking because there is no youth clubs for them to go to, so it is not nice. My kids would often come to me and like I am scared, and I am like: ‘It is fine, it is fine, they are just doing their own thing’… You know, I was used to it because I grew up in that area erm, but I would definitely say… I am in a house now and I have got a garden, it is not massive, but it made the world of difference to everybody’s like mental health I think. Rather than being like cooped up in a flat.
Man 2: Granted there are a lot of parks and that, but I think if you have got that outdoors space immediately outside of your house then it makes it far better for parents. Like if we weren’t parents then I suppose if we were in a flat then we might have managed a little bit better but that is why we needed it, mainly for the kids.
Woman 2: Can you imagine them taking them to a park or thinking ‘Oh god I need to take my kids to a park’ to have that little outside space, every day that has to become part of your daily task along with everything else. Like it’s, you know, it becomes more of a chore than something that is enjoyable for you all to do. Well, from a parent’s perspective I think.
Working-age adults without children said that a one-bedroom flat would be adequate for either a single adult or a couple without children. Flats would be rented from a private landlord because this demographic group would be very unlikely to be eligible for social housing unless they had complex additional needs. In previous years, groups said that unfurnished private rented accommodation would include flooring, curtain poles or rails, a cooker, a fridge freezer and a washing machine as a standard package. In 2024 they said that only the flooring, cooker and curtain poles were likely to be included in lower-cost rental flats, so tenants would be expected to provide their own fridge freezer and washing machine. Private rents rose by 8.9% in the 12 months to April 2024 (Office for National Statistics, 2024b), so it is possible that lower-rent properties now offer fewer amenities as standard than before.
Research transcript - single working-age women without children, Newcastle:
Woman 1: It is very unlikely, very rare, to find furnished places now. Or they put the rent up quite a bit just to cover the cost of if the fridge or anything broke, so 9 times out of 10 I would say people don’t have furnished places already.
Woman 2: So like they don’t have an oven and stuff.
Researcher: So you’re talking about the white goods as well, so the fridge freezer and the…
Woman 2: Yes.
Woman 1: So like when I moved in, I didn’t have anything, I had to get it all.
Woman 3: The cooker might be there because it is integrated – they don’t take them out.
Woman 4: I rent, and I had all of that, it was unfurnished, but the kitchen was covered so I guess it just… it does depend.
Woman 3: Depends on the landlord I think doesn’t it?
Woman 4: It is 50/50 it just depends on who she [the case study under discussion] rented off because obviously some have, some haven’t so…
Woman 2: I think given the prices of things going up at the minute I would calculate that she would need to buy them herself.
Woman 3: I have moved 3 times and every time I have had to get my own white goods. The only thing that has been included I would say is an oven every time but that is because they are either built in or it is just a really old oven.
Researcher: OK so would it be reasonable for us to kind of build in that [the] cooker or oven would be there, but she would have to get the rest of the white goods?
Woman 3: Yes.
The groups of retired people also talked about the precarity of private renting and the difficulty of moving from a private tenancy to social housing, again because of a lack of availability of appropriately sized accommodation. They agreed that a one-bedroom flat would meet the minimum needs of a single pensioner and that a 2-bedroom flat would be needed by a couple, despite the fact that if the case study pensioners were to become in need of social housing now (rather than in the past) they would be likely to be allocated only one-bedroom accommodation, which groups considered to be less than adequate.
Research transcript - partnered pensioners, Manchester:
Man 1: We live in a rented property and 18 months ago, we had been renting a property for 12-and-a-half years and she wanted us out, she was going to sell it, blah, blah, blah, went down the route of trying to get erm… a council house or a council flat, 2 bedroom, no way on god’s green earth were we going to get a 2-bedroomed, even though every weekend we have grandchildren stay. There is no way they won’t give us a 2-bedroom flat or a 2-bedroom house. That is a fact.
Researcher: Is that because there aren’t very many of them or because they… would they give you a one-bedroom rather than a 2-bedroom?
Man 1: It is one bedroom and the one-bedroom flat that they were trying to give us, I wouldn’t have put a dog in it.
Researcher: The reason that 2 bedrooms is there is because when groups were kind of thinking about what erm John and Mavis [the retired couple case studies] needed, they said as you get older… that bedroom is there if one of you is, you know, coughing a lot in the night, the other one can go and sleep in a different room. Having that space when there is 2 of you in a flat, as a minimum, groups said that was a reasonable expectation. What we’re hearing increasingly is that even though that is a reasonable expectation, it doesn’t actually exist in lots of places. And it varies wildly across the country… So the fact that you can’t access 2-bedroom flats or that certain housing is incredibly difficult to get… people are on lists for years and years and years to access social housing. This part of this work kind of helps to inform thinking about that. Does that make sense?
Man 2: We’re saying what we should [be able to access] or require and you’re saying the Government can’t do that or won’t do that so what we would like to say is: ‘This is what we would like, but this is what we can’t get.’
Decorating, maintenance and insurance
All groups included a modest annual amount to cover minor repairs and provide a resource to maintain their rental property to a satisfactory standard, for example by repainting a room occasionally. Parents also included a small amount of equipment and an annual budget to be able to keep the garden tidy and repair or replace fencing occasionally, as this is tenants’ responsibility in social housing. All household budgets include the cost of contents insurance with cover for accidental damage, calculated using quotes from price comparison websites.
Table 4 summarises the housing specifications for each household type. All accommodation is assumed to have gas central heating.
| Household type | Accommodation |
|---|---|
| Single pensioner | 1-bed flat, social housing |
| Couple pensioner | 2-bed flat, social housing |
| Single working-age adult | 1-bed flat, private rented sector |
| Couple working-age adult | 1-bed flat, private rented sector |
| Lone/couple parent plus one child | 2-bed house, social housing |
| Lone/couple parent plus 2 children | 3-bed house, social housing |
| Lone/couple parent plus 3 children | 3-bed house, social housing |
| Couple parent plus 4 children | 3-bed house, social housing |
Domestic fuel
Despite quarterly energy price caps being introduced to mitigate the effects of the dramatic increase in wholesale energy prices since mid-2021, survey data shows that fewer people are using central heating as a main method of heating their home over time. In winter 2021, 78% of UK homes were using gas central heating, with only 3% relying on portable electric heaters. However, gas and electricity prices continued to rise in 2022 and 2023 and the latest data shows a drop to 58% of homes using gas in 2022 and 2023 and a rise to 14% of homes using portable electric heaters as their main heating source by winter 2023 (Department for Energy Security and Net Zero, 2024a). This seems in line with widespread consumer advice to ‘heat the human, not the home’ as a way of keeping domestic fuel bills down (Monro, 2024).
The Department for Energy Security and Net Zero (2024b) estimates that there are 3.17 million households in fuel poverty in England. However, MIS is based on setting a publicly agreed standard of what people should be able to do and how everyone should be able to live, and this includes being able to heat one’s home adequately. Participants were very aware of the rise in gas and electricity costs over time, and discussed the pros and cons of changing behaviours in order to economise on this expense. This included parents debating the inclusion or exclusion of tumble dryers, when the alternative was to rely on the central heating and radiators to air-dry laundry. Working-age adults talked about using air fryers as a more economical way to cook, and pensioners discussed whether or not to include an electric blanket because it was seen as ‘cheaper than putting the heating on’. However, groups agreed that people should be able to afford to use their heating to keep warm, and based on this premise, said that additional items such as heaters and electric blankets would not be required.
The homes in the MIS budget calculations are assumed to have gas central heating as this remains the prevalent means of heating homes in the urban UK. MIS domestic fuel budgets are calculated by a home energy expert, based on indicative housing plans and with the heating set at a level that would maintain the fabric of the property as well as the health of the occupants. Leaving some rooms unheated during cold weather can lead to problems with damp and mould (Centre for Sustainable Energy, 2022), which in turn can have a negative effect on people’s mental and physical health (Department for Levelling Up, Housing and Communities et al., 2023). The fuel element of the budget therefore reflects the cost of sustaining a level of consumption based on meeting needs, rather than on price. Chapter 6 shows what proportion of household budgets comprises domestic energy costs and how that has changed since 2023.
Food and drink
To develop the food budgets for different households, groups are asked to decide what meals, snacks and drinks households would consume at home, and then these specifications are used by a nutritionist to compile weekly menus and required ingredients. At this stage, the nutritionist also suggests foods to add in or change so that the food budget reflects a diet which is in line with healthy eating guidelines. The nutritionist’s suggestions are taken to further stages of groups to check that they are reasonable.
A typical day’s food includes:
- 3 meals a day (breakfast, a light lunch and a substantial dinner)
- one or two snacks (in the morning and/or afternoon)
- drinks such as water, cordial, fruit juice, tea and coffee
- a modest amount of alcohol for adults.
The list above applies to food eaten regularly at home. Eating out, takeaways and food for festive celebrations are covered in the section on ‘social and cultural participation’ below. Within the weekly menus, groups specified a mix of meals made from scratch, some using ready-made sauces and a few pre-prepared items for convenience. For households with more than one member, the nutritionist creates a combined menu based largely on her original ones and allowing some variation, especially in relation to breakfast and weekday lunches where children, parents and working-age adults are all more likely to be out of the home and eating separately from other household members.
We price the resulting food baskets, compiled from all of the week’s ingredients and food and non-alcoholic drink items for:
- working-age adults (singles and couples)
- pensioners (singles and couples)
- partnered parents plus toddler
- partnered parents plus preschool and primary school aged children
- partnered parents plus preschool, primary school and secondary school aged children
- partnered parents plus toddler, preschool, primary school and secondary school aged children
- lone parent plus toddler
- lone parent plus preschool and primary school aged children
- lone parent plus preschool, primary school and secondary school aged children.
In 2022, we revised the method used to construct the food basket for the households without children, to take into account that the UK population as a whole has increased in weight since the first iteration of MIS research published in 2008. Our analysis compared the average weight and height of both men and women using more up-to-date values, and assumed moderate activity and exercise levels. This is more reflective of current societal norms and requirements.
Groups discuss whether the food should be priced all at one shop or at a range of different retailers. Some budget retailers (particularly Aldi and Lidl) are widely perceived as being cheaper than the main supermarket chains (Asda, Sainsbury and Tesco), although the latter all price-match with competitors, including the budget retailers. However, groups agree that Aldi and Lidl’s product ranges are not as extensive as those of the major supermarkets, which can mean going to other shops for particular items and ingredients, which has a time cost. Cheaper supermarkets can often be harder to access in some urban locations, as they are often on the outskirts of a town and may be difficult to reach by public transport.
So far, groups have agreed that we should continue to price the whole list in Tesco so that people can buy it all under one roof if they choose to. Consensus is that we should use prices mostly from the supermarket’s own or generic brand, but not the ‘basic’ or ‘no frills’ range. This and the inclusion of a few branded items (usually because of special offers at the time of pricing, or because the pack size means less wastage in terms of the quantity required) mean that there is flexibility in the budget to upgrade some things and economise on others. People would have the option of making their budget go further by buying more from the budget stores and only a few things from Tesco, and/or downgrading the quality of some items in order to upgrade others (usually better-quality meat is mentioned in this context) using the money saved. We include discounted Clubcard prices where appropriate (Tesco Clubcard is free to join and offers price reductions on a range of items each week) to reflect realistic shopping behaviours.
Clothing
The types of clothing and footwear that groups listed were similar to those in previous MIS reports. They identified the need for a range of shoes and clothing for everyday wear, special occasions and sports activities, as well as school uniform for school aged children (see below). As in previous years, groups specified that the majority of clothing and footwear for all households could come from relatively cheap high-street retailers, with some exceptions. For example, they included a pair of Clark’s shoes for each child to provide good foot support as they grow, and similarly each adult had a pair of good-quality ankle or walking boots. The frequency of replacement reflected item quality. For example, groups said that all adults’ t-shirts could come from the supermarket, but would be replaced every one to 2 years. Meanwhile, adults’ thick winter coats, which tended to be specified as better quality, tended to have a replacement rate of every 3 or 5 years. Children’s clothing mostly needed to be replaced yearly, to take into account the rate at which they grow.
For children, groups included everyday and special-occasion clothing, summer and winter wear as well as fancy-dress costumes for very young children. In addition, groups included school uniform for primary and secondary school aged children. Groups in MIS research have always included a mix of branded uniform items from school stockists and unbranded items from the supermarket, with secondary school children typically needing more branded items than primary school children. Statutory changes in 2021 called for schools to reduce the number of unnecessary branded items required in their uniform policies, to decrease costs for families (Department for Education, 2021). While the guidance is legally binding for all state schools, what counts as a reasonable or necessary quantity of branded items is open to interpretation, and guidance has been followed with varying success (Thomas, 2023; Walker, 2023).
For primary school aged children, although groups said that the number of branded items varied from school to school, they agreed that the number required had reduced overall. For example, in 2020, groups said that primary school children needed 3 branded school jumpers from a uniform stockist, whereas in 2024, groups said that only one would be needed from the stockist, with the remaining 2 plain and priced at the supermarket. Similarly, groups in 2020 included 2 of 5 polo shirts from the school stockist, while the 2024 groups said that all polo shirts could be plain. Groups agreed that a branded school jumper was still needed as schools may still stipulate that children wear such an item to take part in activities such as school trips or photographs.
Meanwhile, the number of branded items that secondary schools expect their pupils to wear remains higher than at primary school. In comparison to 2020, groups in 2024 included the same branded uniform items, including jumpers, blazers and school ties, and added school-branded physical education (PE) items. Groups also talked about the limited support with uniform costs, noting that while secondary school students typically need to wear many more branded items, there were fewer schemes available, such as second-hand uniform swaps, in comparison with those in primary schools.
Research transcript - parents of secondary school children, Leicester:
Researcher: Is there anything else on there that you think needs to come from the school stockist?
Woman 1: All the PE kit does at our school.
Man 1: Yes.
Woman 2: Yes, they have got to have the logo on.
Woman 1: They don’t help you, do they?
Woman 2: I think in primary school, the PE, the jumpers, the t-shirts, you give back to the school and then you have… a day of second-hand uniforms, but in senior school that doesn’t happen.
While secondary school uniforms have historically cost more than primary school uniforms, group discussions suggested a widening gap between the 2 school stages. Families with children attending primary school in 2024 can keep costs lower than in 2020, purchasing most uniform items from supermarkets, while the proportion of branded uniform items for secondary school children has remained high.
Household goods
Items in this category include:
- furniture
- flooring (for those in social housing)
- soft furnishings
- appliances
- small electrical items
- cookware, kitchenware, crockery and cutlery
- cleaning and laundry supplies
- children-specific items (for example, stair gates, highchairs and baby monitors).
Many of the items in the list of household goods have remained the same over time, with groups in 2024 suggesting similar types of items, retailers and rationales for their inclusion to those suggested in previous MIS research. Some of the household goods in MIS serve a practical purpose, such as providing storage or the means to prepare and serve food. Some specifications for household goods were about achieving physical wellbeing and comfort. For example, groups said that people need a good-quality mattress to ensure a good night’s sleep. Similarly, blankets were included in the living area and bedrooms for cosiness. In other cases, household goods were specified partly for social participation. The types of seating in the dining and living areas, and the quantities of crockery, cutlery and glasses, for example, were intended to enable households to have enough for themselves and some guests, while a budget for enabling a household to put their personal stamp on their home acknowledged the importance of making a space feel homely.
Housing tenure also influenced household goods. For pensioner households and households with children, groups specified that tenants in social housing would need to provide flooring themselves, while working-age adults without children would not need to factor this in as it would be supplied in the private rental sector by landlords. A change in this year of MIS research was that groups said that fewer white goods were provided in the private rental sector, indicating that working-age households without children would need to buy their own fridge freezer and washing machine. Groups said that cookers were more likely to be provided in private rental properties because they were more likely to be a kitchen fixture. All groups agreed that a dishwasher was not an essential item, so did not include it.
Groups considered the energy efficiency of some household items, particularly kitchen appliances, in different ways. Groups of pension-age households specified that the energy efficiency of the cooker, fridge freezer and washing machine should not be below a B energy rating. Groups of working-age households with and without children did not specify a high energy rating for those appliances.
Groups specified that all households should have airers for drying laundry. Parent groups discussed the needs of different household sizes and how much washing could be dried on radiators.
Research transcript - parents, Derby:
Woman 1: It is a time… for me it is a time thing as well, I mean I have got 3 kids, but it is also… I would love to have the time to erm you know wait for stuff to dry and all the rest of it, I just need to get those jobs done, kind of thing, so it gets out of the washing machine into the dryer and move things along like the factory that is the household kind of thing around the house.
Woman 2: Yes I have got a spare room that was an office, now is a laundry room, it is that that is where everything goes because otherwise it would be in the living room, it would be in the kitchen, it would be in the bedrooms, it is just not big… we don’t have a big-enough space for that.
Woman 3: I do wonder as well, if we’re talking about this, maybe this sort of household, you know, especially if you’re limited on space, drying stuff on dryers, I do think the health thing – because it says they are in a reasonably good state of health, you know, and I do think all of that indoor drying… We see it with tenants, I mean the moisture it creates erm and that is, you know, health-wise, in the long term I don’t think that is good for… especially if there is children, so I think the dryer has multiple benefits.
Eventually, the consensus was that households with 3 or more children would need a tumble dryer, which is the same as groups have decided since 2008. In 2024, for the first time, groups also discussed whether it was better to include a more expensive but energy-efficient heat-pump dryer or a cheaper condenser dryer with higher running costs. They concluded that it would be preferable to include the heat-pump dryer to maximise energy efficiency.
Meanwhile, working-age households without children and pension-age households included a small air fryer as this was considered an energy-efficient way to cook meals. The parents’ groups also discussed air fryers but concluded that they might not be adequate for larger households.
As in previous years of MIS research, groups said that most household goods could come from relatively inexpensive retailers, such as supermarkets, Argos, B&M and The Range. Pensioners sometimes specified higher-quality goods, but with longer lifetimes than those that other groups specified. They said that older people need sturdy furniture items that can be delivered already assembled. All groups said that items such as beds and sofas should come from retailers where consumers can try them in-store before they buy them. Therefore, these items were costed at retailers such as DFS, Dreams and IKEA. Parents have typically been the only groups in MIS research to include items from IKEA, as the only household type in MIS with a car. However, with the reduction in delivery costs charged by this retailer, now also factored into some households’ budgets for deliveries other groups said this would be a reasonable option.
Household services
Items in this category include:
- phones
- broadband
- postage and deliveries
- babysitting
- childcare.
Groups agreed that each adult and secondary school child needed an inexpensive mobile phone, in keeping with the consensus from previous years. However, this year there was more detailed discussion of the capabilities of a ‘basic’ smartphone to meet their minimum requirements. Groups talked about needing phones for email, online banking, shopping, paying bills, ordering repeat prescriptions, finding information, engaging with official agencies, applying for jobs, taking photos, connecting with friends and family and accessing entertainment. While still a long way from the most expensive models, it was clear that the very cheapest smartphone handsets would not suffice for this level of functionality. Participants noted that some mobile apps were now far more demanding of both storage capacity and processing speeds, and gave examples of where the cheapest smartphones had not been adequate.
Research transcript - lone parents, Edinburgh:
Woman: It doesn’t work, so my dad had that phone and ended up having to keep on installing an app… uninstalling something he wasn’t using to be able to use one that he was and switch the apps… And then he gave that to my daughter when she was 11, so she was only really using Duolingo and like a couple of games and very quickly didn’t have enough storage on it to be able to use like 2 or 3 apps.
Research transcript - partnered fathers, Birmingham:
Man: So I would say you have got to go over an entry [level phone], because most of the entry-level Androids nowadays can’t run half the apps.
Researcher: Right.
Man: I know that because mine broke and I had to go and buy one to temporarily make calls and I couldn’t install my email, I couldn’t install various stuff because it didn’t have enough memory.
The mobile phone that groups included was priced at Tesco Mobile for all groups, through 2-year contracts that include unlimited calls and texts as well as the phone handset itself. Groups discussing the needs of secondary school children, pensioners and working-age adults without children opted for a Motorola smartphone that was one up from the cheapest monthly prices that Tesco Mobile offered. Parent groups described particularly heavy usage requirements, because of also needing specific apps to liaise with their children’s schools about homework, school dinners, clubs, activities, meetings and other arrangements; consequently, the parents settled on a slightly higher-spec phone (also Motorola), which was the cheapest from Tesco Mobile with 128 gigabytes (GB) of storage and 4GB of random-access memory (RAM). Parents included a sturdy phone case and a screen protector for secondary school children’s phones to help protect them from accidental damage.
All groups specified a need for broadband internet at home and agreed that the majority of internet data consumption would use Wi-Fi connections, to minimise additional costs. Pensioner groups said that the Tesco Mobile phone contract’s default 500 megabytes (MB) of data a month provided an adequate level as a minimum for pensioners. For parents and secondary school children the minimum was 3GB of data a month. Parents agreed that learning to manage a limited amount of data was an important skill for children to develop. Working-age adults without children agreed that a 6GB data package would be suitable to ensure that people could use their phones as required when out and about.
Landline phones were not considered necessary by the parents or working-age adults without children, although pension-age groups continued to include a landline service and pair of landline phone handsets as a back-up option in case their mobile phone was lost, broken or out of battery, or to provide handsets with larger buttons. Participants were aware that traditional landline technology will soon be fully replaced by internet-based digital voice systems, but this had not been rolled out universally at the time the fieldwork was conducted.
Budgets for postage and deliveries were included for all household types, with differing emphases on online shopping (where free delivery may not always be available and return costs are sometimes incurred) and sending cards and presents.
Babysitting
Parent groups allocated budgets for babysitting, so that they could spend some time together or take part in activities outside the home without their children. The expected frequency of using a babysitter varied widely between participants, but partnered parents agreed on a minimum of £20 every 2 months. This set-up assumed an informal arrangement such as buying a takeaway pizza for the babysitter, with a reciprocal deal through which one of the parents would in turn babysit for their sitter’s children on another occasion. The groups said that the partnered parents could alternatively choose to spend this money on a more expensive babysitting service that they would use less often, or put it towards a special ‘date night’ meal at home while the children were in bed.
As in previous years, babysitting was a particularly significant need for lone parents, who noted that reciprocity can be more difficult for a single parent with sole responsibility for their own children, and that they would not have the option of going out alone while a partner looked after the children. To accommodate people without a suitable network of informal support in place, the lone parents included an amount for a member of staff from a nursery or agency to babysit for 2 or 3 hours once a fortnight.
Childcare
Parent groups also discussed childcare, acknowledging that help from relatives or friends was not available to everyone, and agreeing that nurseries were the necessary minimum to budget for to allow parents of toddlers and preschool children to work – while still providing the choice of a childminder (usually at a cheaper rate) if they preferred. This has been the consensus in MIS budgets for families with young children since 2016. After the disruption caused by the pandemic, participants said that nurseries would be a more reliable source of care, rather than potentially depending on a single childminder and their child(ren) remaining in good health.
Research transcript - parents, Sheffield:
Man 1: Our kid’s in a nursery, which was unfortunately… sort of forced to do that, but I know childminders, they struggled a bit more because… they are providing childcare, and they are poorly, or their kids are poorly, there is no childcare – and then you’re stuck, aren’t you then? So that was sort of one of the reasons why we didn’t go down that route, but I suppose we were fortunate, we had that choice that we weren’t bound so much by going for the cheapest option…
Researcher: So there are different options, it doesn’t mean everyone has got choices because of income. But again, thinking about where we set the standard rather than what people can afford, should we set the standard at the childminder level… or should we set it at the nursery level?
Woman 1: Nursery.
Woman 2: Nursery level, yes.
Researcher: Right, so why is that?
Man 1: I think like we were just saying just now, where the fact obviously, childminder, only takes them to go down with Covid, that is them out of action for 5 days you know or whatever it is… whereas in a nursery, there is always that back-up if someone is sick, they have usually got some sort of…
Researcher: So you have got a bit more reliability, yes?
Man 1: It doesn’t have to be a week of Covid, it can just be one day of D and V [diarrhoea and vomiting] and that can just throw your week out.
Full-time nursery provision 5 days a week was considered essential because of the need to allow for full-time work. Assuming a 9am to 5pm working day, this meant childcare between 8am and 6pm to build in time for travelling to work and possibly dropping off other children at a school elsewhere. Groups said childcare would be needed for 50 weeks of the year, with the remaining 2 weeks being accounted for by bank holidays and closure over the Christmas period. Groups in England said that the existing scheme providing 15 hours of free childcare a week (for 38 weeks of the year) for 3- to 4-year-olds was widely available, but there was more uncertainty about the availability of 30 hours of free provision for these children (when eligible), as well as the expanded versions of the ‘free hours’ childcare subsidy scheme that are scheduled to start in September 2024 and September 2025.
For primary school children, the childcare budgets include breakfast clubs and after-school clubs during school terms, again to allow for parents to work full-time. Outside of term-time, the groups expected the parents to use their annual leave to look after their children as much as they could. Assuming 4 weeks’ leave a year per parent, this left a remaining 9 out of 13 non-term weeks when a single parent would have to use holiday clubs for primary school children, and an equivalent 7 out of 13 non-term weeks of primary school holiday clubs for partnered parents if they took one week of leave at the same time as each other for a family holiday.
Groups did not think that potential flexibility for working from home post-Covid was widespread or significant enough to have an impact on these childcare requirements. Groups also acknowledged that for some workers it can be difficult for parents to take time off work during school holidays, depending on their job and the leave requests of colleagues. There was no budget for childcare for secondary school children, but groups agreed that they would need some extra money to entertain themselves during school holidays (this is included in their leisure budget).
Health and personal care
Items in this category include:
- toiletries (soap, toothpaste, shampoo and so on)
- hairdressing costs
- home healthcare (for example, paracetamol, ibuprofen and hay fever tablets)
- prescription costs
- dentistry
- opticians
- other health costs.
Groups listed the types of toiletries and personal items usually included in MIS, such as shampoo, shower gel and sun cream. A notable change this time was that participants added personal items for working-age men without children that have previously only been included for working-age women, such as a monthly cosmetics budget, hair bobbles, hair clips and makeup remover.
Research transcript - single working-age adults without children, Cardiff:
Man: I think everything should be included [for men] because there are some guys who [wear] nail polish, some guys who have long hair will use dry shampoo, they will use hair bobbles, use hairbrushes and use hair clips.
Woman: I feel like it is hard to genderise toiletries.
Groups also aimed to be more inclusive with the budgets for hairdressing and haircare costs, to acknowledge a diversity of hair needs. Groups said that people with different hair types and textures, for example hair that is very curly, wavy or coily, may need to visit hair salons more frequently, they often have difficulty finding suitably qualified stylists and they pay more for hairdressing services and hair care products.
Research transcript - parents, Manchester:
Woman: It… adds up… It is not the same price for me to just… I can’t go to any hairdresser and say: ‘Oh can you do my hair?’ It is like 3 times as much for us… As a black woman, I never sat down with my mum or whatever so I don’t know how to look after my hair, so I have to rely on somebody else to try and help me look after it… not everyone has them skills, so they do have to go to a salon to maintain it… I can’t just scrape it up… I have to have some sort of product.
To reflect a diversity of haircare needs, groups decided on a budget per person that would mean that working-age adults and school-age children could visit a hairdresser monthly, and could cover a broader range of styles, such as braiding of people’s natural hair. A budget for preschool children also included a hairdressing visit, but less frequently, while groups said that toddlers did not need to visit the hairdressers. Groups included amounts to allow for the use of additional haircare products. Pensioners included enough in the budget to cover regular trims at a salon offering concessions and a home box dye for pension-age women. Primary school aged children had head-lice treatments and a nit comb added.
All groups said that accessing healthcare appointments was challenging. For example, they described the difficulty of getting an appointment with NHS dentists, an issue that has developed over almost 2 decades but grown exponentially since the Covid-19 pandemic (Green et al., 2022; Omer, 2023). Despite this, participants included the cost of accessing an NHS dentist so that adults could have regular check-ups, as well as an NHS band 2 treatment every year (covering a filling or extraction), in keeping with previous years of MIS research (dentistry is free for children). Groups added an additional healthcare budget of £200 a year per parent or working-age adult so that they could pay for health-related services (for example, physiotherapy or counselling) if necessary until reaching the top of an NHS waiting list. They acknowledged that it is becoming more difficult to obtain these services via the NHS, and even where it is possible, waiting lists are long.
Research transcript - partnered mothers, Sheffield:
Woman 1: It happens in life, your back goes or your leg goes, or…
Woman 2: That is it. It is for things that the NHS don’t cover, which is a lot now.
Woman 1: Chiropractor doesn’t come under that…
Woman 2: Everybody should be able to budget for that.
Research transcript - lone parents, Norwich:
Woman 1: So I pay for a sports massage for my back, which is triggered from my physio, so the physio was £65, and the sports massage is £36, so that is twice a year if you just have the sports massage, whereas the physio it would just be one trip for the year. But that normally triggers follow-up work is all I am saying, so potentially yes.
Researcher: But is that a need? Because you will have some people who have never been anywhere near a practitioner for any of this stuff, some people who go regularly, some people who have been at some point and accessed it and found it useful but don’t need to go anymore but might again in the future, and so on and so forth. Everybody is different. Does this seem like a reasonable thing to include or is this a ‘nice to have’?
Man 1: A nice to have.
Woman 2: I think the physical is the nice to have, I think the mental [health] is an absolute must have … As in therapy or…
Woman 1: But my physical health impacts my mental health.
Man 1: She [the case study being discussed] is in a reasonably good state of health.
Woman 3: She can still get a bad back.
Woman 1: Jane might be fine; if you look at average numbers, of people in this country or at least families of 2 or 3 people, one of those in that household is going to need the support that is not available.
Woman 2: Let’s say a bare minimum, let’s take counselling for example, that is bare minimum you’re looking at £20 to £25 a session so let’s say once a month because that is all you can afford, it is not a cheap thing to have but… people should be able to have it.
Woman 3: But that is what we’re saying, if we call it say £100, hypothetically speaking, we haven’t analysed that, we are allowing it, we just need to tell them how much we want to allow for this other category. Because Jane may need it for her head, but John [the other case study being discussed] might need it for his back.
Woman 2: OK, then I would say £250 a year.
Woman 4: Are those things that you can access via your GP? For instance…
Woman 2: They are, yes.
Man 1: Yes. Yes I know it is not there…
Woman 4: But you could. Go on a waiting list or something.
Woman 3: And [risk] making it worse as you go along.
Woman 4: And you can say the same about a dentist or an optician, or do you know what I mean? If we look at it like that…
Researcher: So this is a sort of routine maintenance for Jane that isn’t covered by these other things. OK? And so what has changed? Why … why now, why in 2023, almost 24 is this something that is coming in for the first time? Because we have not seen this before, why is that?
Woman 3: Waiting lists.
Man 2: I am trying not to be biased because I am in that field, but you have hit the nail on the head in that it is about the waiting lists. I think they should have something complementary or maybe to fill that void because I think you can get it on a health service for free so… you should be expected to wait to a degree, if you can’t wait you should pay for it.
Woman 2: You have got that ability.
Man 1: But a years’ worth is expensive as it is a lot of money, so it is going to cost about that so… is it more about somewhere in the middle? Some top-up complementary stuff, which is kind of wellbeing…
Woman 4: Because there are other…
Man 1: Can still be expensive but it is probably cheaper then…
Woman 5: Because you could download an app for example, I know… you know there is mindfulness and things like that that is potentially £20 a month, which covers that, so there are other avenues…
Researcher: How you use that resource is entirely up to you and not everybody needs it, what we can’t do is meet everybody’s needs. This is a benchmark we don’t want anyone to fall below but we’re not saying it can meet everyone’s needs, and it might be that some years, again, she needs a lot of help or a lot of visits and some years she doesn’t need any and that will come and go.
Woman 2: Or she might have 3 a month and not for 6 months.
Woman 1: A lot more than…
Woman 3: Maybe £150.
Woman 1: So £150 to £200 a year.
Researcher: So, just to be clear, this is about access and waiting lists and recognition that not everybody can… I was going to say can afford to wait but there are some problems that are too urgent for them to wait.
Woman 2: That is where it is tricky though because an urgent mental health crisis gives you the crisis team… they will go to you ‘OK these are the people that can help you’ and they will give you that care, until they deem you as not a risk, so therefore you are potentially getting that service at your worst… they have then gone ‘OK we have done your risk, we have done this, bugger off now and deal with it yourself’ and then it is not a good state, so it is having that money in the bank to deal with that at the end of it to cover that shortfall.
Man 2: I can see where the £200 is coming from. Because even if you just wanted a massage for a sore shoulder, you’re looking at £60, you’re not looking at… so £100 over a year is nothing so I think £200 as a lump sum, might sound a lot but it is around about the right figure. If you want to use that for whatever you want to for mental health, for a sore leg, for a sore back, that will most probably get you the treatment you need to deal with it.
Woman 2: But that is less than £20 a month really.
Woman 3: Which is not a lot.
Man 2: I think one more thing then is there are waiting lists and I think it is harder to be resilient because of lots of other factors like climate, cost of living crisis. All the things that add to a wellbeing need.
These are just some examples of treatments that an individual may now need to self-fund due to the declining number of NHS-covered services in the UK (Exworthy et al., 2023). Meanwhile other services that are covered by the NHS have significant, and growing, waiting lists, as already alluded to. Waiting lists for NHS physiotherapy, for example, have increased by 27% since January 2023, comprising a total of 323,965 people (Tapper, 2024). Evidence of the rising prevalence of medical self-funding can be found in the burgeoning availability of payment plans and loans for treatments (Gabert-Doyon and Quinio, 2024). Drawing on their personal experiences, groups considered the inclusion of the healthcare budget for some self-funded services vital for wellbeing.
Research transcript - working-age adults without children, Norwich:
Man: Whether it is mental or physical, you need to be able to have the choice to not go with the NHS and see yourself on a waiting list for years and years. You want to just be able to get the help that you need as soon as possible. So, you need the little budget to put towards that.
[…]
Woman 1: Physical, mental [poor health], it can potentially, for example, stop you from working … So if you need to get back to work and you need some sessions on your back to get you there, then you have got to do that if it is necessary.
Woman 2: I think the key thing is [participation] in society … that sort of thing prevents you doing your clubs or socialising, having that human connection, kind of mental side … Actually, I think it is a need to participate in society.
[…]
Man: The waiting lists are getting much longer as well, so we need a budget that can last you until you can reach the top of the waiting list.
As in previous years, pensioners included a budget for podiatry so that older people could access help with taking care of their feet. Groups also included the cost of prescriptions for working-age adults (these are free for pensioners and children) and over-the-counter medicines such as paracetamol, plasters, antihistamines, thermometers and cold remedies.
Eye tests at a high-street optician chain every 2 years were included for working-age adults (these are free for children and pensioners) along with a budget for glasses so that working-age adults and pensioners could have some choice of frames and lenses (for example, varifocals). Groups said that the choice of glasses available through the NHS was adequate to meet the needs of children.
Transport and travel
Transport budgets for households with children include one second-hand car per household, to allow families to meet their needs for travel to work, school, childcare, appointments, activities and socialising. For urban areas outside of London, this has been the case since 2012, as groups agree that public transport is not sufficiently flexible, affordable or reliable.
Groups included a monthly pass for public transport for each working-age adult without children and one pass between each partnered parent couple, for travelling to work without a car (which the other partnered parent would use). Car ownership was seen as a ‘nice to have’ for households without children, although in the UK a large majority of journeys to work are made by car apart from in London (Department for Transport, 2022). Groups said that people needed sufficient resource to travel as far as the next major town or city, to access a range of work opportunities. This has been the consensus in MIS groups since 2018, reflecting perceived needs for flexibility about where people are prepared to work, which are also evidenced by the commuting patterns of a sizeable proportion of the working population. For example, data from the 2021 census shows that even in pandemic-affected March 2021, almost 5 million people, more than a third of those who regularly travelled to a fixed place of work, travelled a distance of at least 10km, while 1.1 million people travelled 30km or more (Office for National Statistics, 2023).
All groups included budgets for some taxi journeys. Groups of working-age adults and parents discussed using taxis for emergencies, late-night travel and in cases of public transport strikes. The parents’ taxi budgets were lower due to having a car, although the family would still need some additional resource for travelling when their car was being serviced or if it broke down. For pension-age adults, taxi budgets were in addition to free bus (and sometimes tram) travel, but could also be needed for public transport fares during peak times not covered by their bus pass, such as for early morning appointments.
Groups discussing the needs of children allocated money for secondary school children to take the bus to school. One bicycle was included for adult use in each parent household. Parents of secondary school children said that if the child had a bike it would be a present (so would come from the gift budget), but they included associated cycling costs such as a helmet, lights, lock and maintenance for each bike in the household.
The transport budgets also include a budget for visiting friends or family further afield and for the one holiday a year agreed for each household type. These journeys are all included in the car mileage for households with children. Pensioners and working-age adults without children have a budget for rail or coach travel. These groups budgeted considerably more for rail travel than had been the case in 2022, partly due to expectations of being able to visit friends or family more often – but also against a backdrop of significant train fare increases: 5.7% in Great Britain in March 2023 (Office of Rail and Road, 2023), a further 4.9% in England and Wales in March 2024 (Topham, 2024) and 8.7% in Scotland from 1 April 2024 (Transport Scotland, 2023).
Social and cultural participation
The social and cultural participation category is about meeting people’s need to socialise, interact and connect with others, pursue hobbies and interests, maintain wellbeing – mentally, emotionally and physically – and take part in cultural practices and traditions (for example, attending a secondary school prom or exchanging gifts at Christmas). This section is divided into the following subcategories:
- technology for home entertainment and connection
- gifts, celebrations, toys, books, pocket money and charitable donations
- other education and stationery costs
- leisure and recreation
- eating out and takeaways
- holidays and days out.
As in other budget areas, these social and cultural participation needs encompass both specific goods (such as a television) and services (like a holiday package) that can be priced. Other items are allocated a budget that represents an amount that will enable people to exercise choice, for example in how they socialise or spend their leisure time.
Technology for home entertainment and connection
This subsection relates to technology-related needs beyond phone and internet provision, which features among the budgets for household services.
All household types included a smart television (TV). Technological developments mean that a non-smart TV is now far more difficult to find, and 4 years ago in 2020 the smart TV replaced the digital TV with built-in Freeview that had occupied the equivalent role in MIS budgets since 2008. Parents and working-age adults both agreed that a 32-inch screen size would be an acceptable minimum. This remains cheaper than larger models, although there are fewer of them available as screen sizes continue to increase. Pensioner groups specified a 42- or 43-inch screen, as they had done in the 2022 MIS budgets, to make the picture (and subtitles if needed) easier to see. All groups included a TV licence, so that people could watch live TV and BBC iPlayer.
There was much discussion about whether to continue to include an additional TV subscription service, such as Netflix, Disney+ or Amazon Prime, which had been another addition in 2020 (at that time replacing a DVD player). The pensioner households and all families with children opted to keep one entry-level TV subscription in their budgets. However, working-age adults without children decided that this subscription was no longer so necessary now that the constraints of Covid have completely lifted. Working-age participants did note, however, that Netflix had become embedded in modern life:
Research transcript - single working-age men without children, Leicester:
Man: ‘Netflix and chill’ I think got added to the dictionary, didn’t it? Which literally means this… is woven into the cultural fabric, and I think that to participate in society he [the case study under discussion] needs a choice to access that.
Yet the participants also acknowledged that these kinds of streaming services now occupied a less central role in their lives than had been the case when “trapped in” at home during Covid lockdowns. While being clear that MIS is about what people need as a minimum, not what people can afford on a very low income, they said that Netflix was relatively low in their priorities compared with other needs.
Research transcript - working-age adults without children, Sheffield:
Man: I think Netflix for me would be, you know, if I was in that situation where I think – I know it is not relevant to this – but if I think ‘Right, I need to cut costs’, that would be one of the first things I would get rid of.
The compromise reached by working-age adults without children was that the adults could choose to use some of their other budgets for leisure activities or putting a personal stamp on their home to pay for a subscription service, if it was important to them.
It was noted that parents and pensioners were perhaps more likely to still spend more of their evenings at home and thus to rely more on home entertainments such as Netflix, a point that pensioner groups in particular emphasised.
Research transcript - pensioners, Leicester:
Woman: And also Covid has made you like… I mean, I find that I don’t want to socialise as much as I used to before, you seem to have kind of been in your own home for 3 years without kind of having that…
Man: Shut down a bit.
Woman: Yes, shut down, and often me and my husband will choose a movie, and it is just nice to watch a movie together.
Research transcript - pensioners, Birmingham:
Man: As I say it is like… as you’re getting older now, obviously you don’t go out so much, you tend to watch TV a lot.
The social inclusion element was seen as especially pertinent for children. Although children might also access entertainment via other platforms such as YouTube and TikTok, parents said that often very popular shows could only be accessed via a subscription, and the cheapest version would be enough to allow their children to watch the same things as their peers.
Research transcript - parents of secondary school children, Birmingham:
Woman 1: My girls loved Stranger Things and they can’t wait for the next one to come out…
Man 1: I think you would feel left out as a child, going back in hindsight, and Stranger Things is probably the best example because there is a group of kids talking about it…
Man 2: As soon as you mentioned Stranger Things then I… again the cogs start whirring, what is that… thing that everyone was on about.
Woman 2: Squid Games.
Man 2: Squid Games, again you are probably right.
Man 3: If you were watching it in real time and you were digesting it in real time, you’re not out of the loop.
Man 1: And I think it is that… on a day-to-day basis you probably could live without it, but it is that one show that suddenly once a year, like Squid Games, like Stranger Things, suddenly you are out of the loop.
Man 2: That is it, that is why I think you need it – because you could be kind of left out a little bit.
Woman 1: Yes, I agree.
Parents of younger children echoed the importance of their children being able to watch the same shows as their friends at school. They also valued having access to a wider choice of age-appropriate programmes for children.
Research transcript - parents of preschool children, Manchester:
Woman 1: All mine watch is Netflix. My 4-year-old absolutely loves it, and I think on the TV because there are only certain programmes on at certain times. Whereas Netflix, if they want to watch something else that is not on, they can. They can watch that, and I think she should have the choice of that…
Man 1: My little girl is Disney+. They like to watch all of the cartoons on there and all of the Disney films, so we get that for them…
Woman 2: I think you should have it. We do a lot of movie nights and stuff, so… I think it is nice as a family.
Woman 1: And because when we were children, we would just buy DVDs, but now you would have to buy the DVDs and the DVD player, so it would be cheaper just getting a subscription to Netflix or Disney+…
Woman 3: Maybe not at age 3, but my eldest, 4 going on 5, when he is going into school now and his friends are talking about what they have watched, if he comes home and says ‘Can I watch it?’, I don’t want to say to him ‘Oh well mummy can’t afford it so you can’t watch it’. Do you know what I mean?
Man 2: My little boy is 2 and obviously we do stuff with like teaching him words and stuff like that. But since he has watched things like Paddington, like he is obsessed with it, he has learned so many more words in a fun way. Like obviously we will sit down with him and do bits, so with Paddington and school and whatnot, but he has learned so much just by watching his favourite programmes because he just loves it and he is… like transfixed by it. So…
Researcher: Right, so we think there might be an educational element to it as well?
Man 2: Yes, there is a little bit to it as well, especially at that age because they are just a sponge to soak up everything. Everything they listen to, every word, so yes.
Ultimately, the consensus among both parents and pensioners was that the cheaper new £4.99 a month package from either Netflix or Disney+ (each with adverts and covering up to 2 screens) would meet their minimum needs for paid-for content, providing a diverse offering to suit different age groups. Some participants were opposed to the principle of paying extra to remove adverts, while others could not justify the additional cost for avoiding just an occasional 25-second advert. The decisions of these groups for different household types collectively reflect several different recent patterns in Netflix’s reported subscriber numbers. Subscriptions fell in the first half of 2022 (which resonates with working-age groups deciding not to include this), before increases in 2023, which were driven partly by people signing up to the lower-cost package with adverts (BBC News, 2024), exactly as the MIS parents and pensioners specified.
Smart speakers appear to have been a more ephemeral phenomenon, at least in MIS. They were added to MIS budgets in 2022 after a rapid surge in ownership, and some participants in this wave of research also said that they regularly used theirs for listening to music or podcasts, or for purposes such as setting alarms and reminders. Nevertheless, on balance the groups for 2024 decided that smart speakers were an unnecessary luxury, because their functions could be carried out well enough by the mobile phones, smart TVs and other devices that were included in the budgets.
Research transcript - partnered parents, Leicester:
Woman 1: To be fair I know so many families that have them and don’t even put them on anymore.
Researcher: Really? Interesting. So this could have been just a bit of a fad because everybody had been at home for Covid, that they found it useful, and that actually that ship has sailed.
Woman 2: We have got 3 sitting around our house, we don’t even turn them on.
Man 1: Never had one.
Researcher: OK, so is that a ‘nice to have’?
Woman 3: I think that is just a fad.
Working-age adults without children still included a cheap digital radio, to provide another option for listening to music.
All households also included at least one additional device with a medium-sized screen, alongside the mobile phones for each adult and secondary school aged child. Parents and working-age adults without children each included one relatively basic laptop (or Chromebook with a keyboard) for a single adult or to be shared between an adult couple. Groups agreed that they needed a device larger than a phone and with a physical keyboard, to make it much easier to use some websites, to send emails and to read or edit documents, although the assumption was still that if they needed a laptop for ongoing work purposes, an employer should provide it. Websites that participants were most concerned about navigating successfully on a smaller phone screen tended to be those with complex forms to fill in or detailed information to read. Groups discussed the option of accessing publicly available computers, for example in libraries, but agreed that limited opening hours and potentially inconvenient locations made this unrealistic. Pensioners specified a tablet that they could use for reading electronic books, games, filling out forms and keeping in touch with family through video calls or social media.
In past years, children were expected to share parental laptops unless there were multiple children in a household. However, groups in 2024 said that secondary school children would each need a device of their own, because of a perceived increase in computer-based homework since before the pandemic. Parents specified a more expensive laptop for the secondary school child (in a £300 to £400 price range) than the one that parents needed. This was to ensure that the children were not disadvantaged educationally by having unsuitable equipment. Similarly, primary school children need access to a tablet for education, with some of their homework being set and submitted electronically, as well as for entertainment. The groups agreed that a mid-range tablet would best meet the minimum need, with a shockproof rubber case to make it more durable.
Some participants had felt the need to purchase Microsoft Office for their children’s use, and others noted that “a lot of things that were free are starting to kind of cost”, expecting to have some paid-for software on their laptops. The groups decided, though, that free versions would suffice, or if children needed to use Microsoft Office, their school should provide it. The working-age adults without children did, however, include a Microsoft Office package to provide extra functionality, especially for editing CVs.
Games consoles were expected to come out of adults’ leisure activities budgets, or for children, to be received as a gift that might involve contributions from several family members. To enable the children to participate in online games with their friends, a low-cost annual subscription was included, as it was when introduced to the MIS budgets in 2020.
Gifts, celebrations, toys, books, pocket money and charitable donations
Groups continued to recognise the importance of marking special occasions and wider cultural celebrations, as an aspect of participating in society and a way of showing appreciation for the people around them. All budgets included some money for seasonal decorations such as for Christmas or Diwali, and for extra food and drink spending for celebrations where people might be hosting visitors, buying more expensive items or attending gatherings where they would be expected to contribute some food or drink. All budgets also included money to buy gifts for people’s close relatives and/or immediate social circles for their birthdays and at another time such as Christmas, as well as setting aside an amount to cover gifts for other occasions such as weddings, new babies, new homes, Easter or other festivals. In children’s budgets, money was allocated for presents and for a birthday tea or pizza for a sleepover with friends, as well as buying presents for the child to bring with them when attending other children’s birthday celebrations.
The younger children’s budgets also include a resource to provide money for toys, books, games or craft materials for use at home. Parents of secondary school children agreed to keep pocket money at the same level as set in 2022 (£10 a week) and this was expected to cover money for meeting up with friends as well as purchases such as cosmetics, accessories, music downloads and other sundries.
Parent groups budgeted some money for primary school or secondary school charity days and fundraising such as Red Nose Day, Children in Need or cake sales, plus a little extra for other contributions to charity. However, the 2024 groups said that any charity donations from pensioners or working-age adults without children would have to come from their leisure budgets.
Other education and stationery costs
The other education-related components of children’s social and cultural participation budgets were broadly similar in 2024 to what they were in 2020, although there were some cost differences. Parents agreed a budget to pay for educational school trips and other school events, plus a 3-night residential trip in year 6 of primary school. Parents still saw attending the residential trip as a significant part of children’s development and social participation.
Research transcript - parents of primary school children, Derby:
Woman 1: It is their first time away isn’t it?
Man 1: Independence.
Woman 2: Because it gives them independence, it gives them an opportunity to be away from the family unit and…
Man 1: They are with their school friends, but they are not at school, they are in a different environment, you know, different social skills, sleeping with… do you know what I mean? Yes, they have got to go.
Woman 2: But also, if that one child doesn’t go and everybody else has, and then that one child has still got to go to school for 2 days, they are going to be put in a class with younger children and… that is going to be absolutely devastating for them.
For secondary school children, the groups allocated a resource for attending curricular school trips involving the whole year group or subject class. They included termly contributions towards the costs of materials (for example, cookery ingredients) and budgets for some stationery, a calculator and some study guides. They agreed that all secondary school aged children should be able to attend their school prom and included enough to cover a ticket, an outfit and accessories.
Groups discussed whether or not households needed a printer. Pensioners and working-age adults without children said one would not be needed. Parents’ experiences varied, with some saying that all homework could be completed and submitted online, while others said that schools insisted that parents print not just homework materials but also even lesson hand-outs and essential forms to be signed. Parents interpreted the offloading of printing responsibilities onto them in such cases as being part of schools’ responses to financial pressure, in a wider context where there have been real-terms spending cuts per pupil for many schools (Drayton et al., 2023; Montacute, 2023). Groups sought to produce budgets for what they saw as average levels of printing, deciding on a £10 a year printing budget for primary school children and a printer with an ink subscription for roughly 25 pages a month per secondary school child.
Leisure and recreation
Since the MIS research first began, groups have agreed that everyone should be able to engage in activities outside their home to pursue hobbies, interests and exercise and to see friends. Pensioners settled on the same level of resource as was agreed in 2022 to cover 2 activities a week. Parents discussed the need to be able to do at least one or two things a week – some potentially with no extra cost, such as walking or cycling – and to have a budget to cover the costs of paid activities, for example a gym membership, socialising, evening classes, cultural events and date nights.
The activities budgets of working-age adults without children were set at a similar level to those of parents. For school-aged children, the budget for each organised activity (such as swimming lessons and scouts) was increased this year to reflect higher prices. Parents said that primary school children needed to be able to do up to 2 activities a week, but that at secondary school this was more likely to be one organised activity a week.
Eating out and takeaways
All groups agreed that people should be able to have an occasional takeaway meal as a break from cooking. For parents, pensioners and working-age couples without children, this was once a month, compared with twice a month for single working-age adults without children, who were more likely to either eat on their own or visit friends and have a takeaway there.
Groups agreed that eating out as a family is an important part of feeling socially included, and it helps children learn how to behave in a more formal setting. As previously, pensioners and working-age adults without children agreed on one meal out a month, while families with children included a meal out every 3 months. The parent groups emphasised that these meals would be for special occasions, and set the budget at a level that would allow for a choice of reasonably priced chain restaurants.
Groups said that lone parents should be able to eat out without their children once a month, for example to have lunch with colleagues, in recognition that socialising in the evenings and at weekends can be more complicated for lone parents.
Holidays and days out
Holidays are another significant component of the leisure budgets that all groups have continued to include. For all household types’ 2024 MIS budgets, this comprises a one-week holiday in the UK, by the seaside. Pensioners and working-age adults without children can each take their holiday outside of peak times; the pensioners specified a coach holiday, and the working-age adults a bed-and-breakfast or half-board hotel stay. Families with children agreed on a self-catering caravan or holiday park by the seaside, such as a Haven site, with a package that would give them access to swimming pools and entertainment venues. If the family had school aged children, their holiday would be in peak time, but without school aged children they could travel off-peak – and groups said that these families should then be able to choose from the full range of off-peak options outside of school summer holidays. To ensure that a caravan of the necessary size would be available at the right time, the parents opted to price in the ‘Bronze’ type of Haven caravan and to book well in advance. All groups included a modest amount of additional holiday spending money so that people could explore the local area, participate in nearby activities and have an occasional ice cream, drink or extra meal out.
Groups continued to underline the importance of holidays as a source of new experiences, relaxation, increased morale, memories, bonding time, breaks from their routine and something to look forward to. As in 2022, the substantial increases in the cost of UK holidays means that a one-week break is more expensive than previously, but it is still seen as a need.
Families with children also budgeted for one daytrip a year, such as to a theme park or a zoo, for another opportunity to do something different and spend quality time together as a family. Budgets reflected the likely use of promotions and offers to get discounted tickets (for example, Tesco Clubcard points), and included the cost of entry, some refreshments (although the family would take a packed lunch) and something from the gift shop.
Despite not including holidays abroad, as in previous years, all groups agreed that each adult should be able to have a passport, primarily for identity (ID) purposes, with extra salience now that voters are required to provide photo ID at polling stations (Johnston and Uberoi, 2023).
4. MIS budgets in 2024
MIS is based on specific budgets that are calculated for a range of individuals and household types. Minimum budgets are produced for working-age adults with and without children, and pensioners, with separate budgets for single and couple households within each of these 3 demographic groups. To calculate budgets for different household configurations, minimum individual budgets are also calculated for 4 different age ranges of children: aged 0–1, aged 2–4, primary school age and secondary school age. In this chapter and the next, we focus on 4 example households:
- a single, working-age adult
- couple pensioners
- a lone parent with 2 children
- a couple with 2 children.
The illustrative households with children include one child aged 2–4 (a pre-school child) and one primary school aged child, and we assume that both households require full-time childcare for the pre-school child due to parents working full-time.
Table 5 sets out the weekly budgets for these 4 household types, disaggregated into broad categories of expenditure. The rebasing of all MIS budgets in 2024 has resulted in a small decrease for households without children, for the first time since 2014 for a single working-age adult and since 2012 for couple pensioners. The reasons for this decrease in their minimum budgets are explored in the discussion of the overall composition of budgets in this chapter. For households with children, MIS budgets have increased substantially. Some of this is a consequence of increases in prices, some is a result of changes in the composition of a minimum budget – that is, what the public have agreed is needed in order for these households to live with dignity in the UK – and some is a result of a change in methodology in how the food basket element of MIS is calculated. The increases in budgets for households with children have been driven mainly by changes in the food, personal goods and services, and social and cultural participation elements of the budgets.
Figures 2 to 5 show how the overall composition of minimum budgets for the 4 example household types set out in Table 5 has changed between 2020 and 2024.
| Single adult, working age | Couple pensioners | Lone parent, 2 children, one aged 2–4 and one primary school age | Couple, 2 children, one aged 2–4 and one primary school age | |
|---|---|---|---|---|
| Food | £74.39 | £124.66 | £143.98 | £198.95 |
| Alcohol | £7.97 | £12.03 | £6.67 | £13.35 |
| Clothing | £13.95 | £16.53 | £34.14 | £49.43 |
| Water rates | £9.24 | £10.91 | £14.38 | £14.38 |
| Council Tax | £21.38 | £28.51 | £24.94 | £33.26 |
| Household insurances | £1.92 | £1.10 | £6.69 | £6.69 |
| Fuel | £28.28 | £31.00 | £40.79 | £43.16 |
| Decorating and maintenance | £1.92 | £3.84 | £3.84 | £3.84 |
| Household goods | £15.97 | £22.95 | £38.82 | £38.61 |
| Household services | £3.33 | £7.48 | £20.25 | £7.56 |
| Childcare | £0.00 | £0.00 | £273.10 | £267.10 |
| Personal goods and services | £43.30 | £59.62 | £85.17 | £112.20 |
| Motoring | £0.00 | £0.00 | £84.48 | £84.48 |
| Other travel costs | £43.78 | £13.81 | £6.18 | £37.60 |
| Social and cultural participation | £58.41 | £82.38 | £137.07 | £167.58 |
| Rent | £113.92 | £110.81 | £116.98 | £116.98 |
| Total excluding rent and childcare | £323.85 | £414.80 | £647.39 | £811.07 |
| % change since 2023 | -2.0% | -3.0% | 19.0% | 22.0% |
| £ change since 2023 | -£5.98 | -£13.90 | £103.96 | £145.59 |
| Total all | £437.76 | £525.61 | £1,037.46 | £1,195.15 |
| Total excluding childcare | £437.76 | £525.61 | £764.37 | £928.05 |
| Total excluding rent, childcare, Council Tax and water (comparable to‘ After Housing Costs’ income measure) | £293.22 | £375.39 | £608.06 | £763.43 |
| Total excluding childcare and Council Tax (comparable to ‘Before Housing Costs’ income measure) | £416.38 | £497.11 | £739.42 | £894.79 |
| Total excluding rent, council tax, childcare | £302.47 | £386.30 | £622.45 | £777.81 |
Note: A full breakdown of what is included in each category can be found in the ‘Household budgets’ section of the Centre for Research in Social Policy’s website.
Across all of the 4 households set out here, the budget required for domestic fuel has fallen since 2023. This is a consequence of changes in the energy price cap capping both the price per kilowatt hour (kWh) and standing charges that consumers pay, which started to reduce in July 2023, with a further reduction in most quarters since then. The result of this is that the single working-age adult’s weekly domestic fuel budget has decreased by £11.87, the couple pensioners’ fuel budget has fallen by £12.45, the lone-parent household’s fuel budget has fallen by £17.85 and the couple-parent household’s fuel budget has fallen by £18.79 – this is a decrease of around 30% for all households set out here between 2023 and 2024. These changes in prices mean that the domestic fuel budgets in 2024 are also below the level they were in 2022. A further reduction in the price paid by consumers came into effect in July this year, but this has not been taken into account in calculating the MIS budgets for 2024 as these are for April 2024.
There has been a change in travel costs for all households. As outlined in Chapter 3, working-age adults without children and pensioners increased the budget included for rail travel to visit family and friends further afield. For single working-age adults this increased from £100 a year in 2022 to £300 a year in 2024; for couple pensioners, groups included 3 rail journeys a year, per person, at a cost of £60 each time, more than the £100 per person a year included in 2022. The couple pensioners’ transport budget has decreased overall as the amount included for taxi journeys has been reduced from £15 a week to £30 a month. Travel costs for households with children have also decreased overall – while there has been an increase in the cost of second-hand cars, motor insurance, fuel and the amount included for taxis, there has been a decrease in the amount included for parking, from £15 a week in 2022 to £10 a month in 2024. In combination, these changes have produced a small decrease in the minimum transport budget in 2024.
The budget required to meet the cost of food – inside and outside the home – has increased for all households except single working-age adults. These changes are summarised in Tables 6a-6d, which reveals an unintended consequence of uprating minimum budgets in a period of high inflation, as well as the impact of a methodological update bringing the methodology for households with children into line with that for households without children. The amount needed to cover the cost of a weekly food shop for single working-age adults has remained stable over the past year, despite the composition of the weekly food menu having changed: this element of the food budget was £63.96 in 2023 and is £63.43 in 2024. What has changed in the latest research is the amount included to cover the cost of eating out: in 2022, working-age adults included £45 a month for eating out once a month; in 2024 this was £30 a month. For couple pensioners, the amounts included for eating out and takeaways have increased since 2022, with groups including £60 a month for eating out in 2024 (compared with £50 in 2022), and £24 a month for takeaways (compared with £30 in 2022), giving a total of £84 a month for the household, £4 more than in 2022 (a 5% increase). However, uprating this element of the food budget by the Consumer Prices Index (CPI) in 2023 resulted in the 2022 costs increasing by 9%. Consequently, while in cash terms the amount that groups have included has increased over time, this budget element has fallen. In periods of relatively stable inflation, these sorts of peculiarities are far less likely to happen.
| 2020 | 2021 | 2022 | 2023 | 2024 | |
|---|---|---|---|---|---|
| Food prepared at home | £45.34 | £45.12 | £53.60 | £63.96 | £63.43 |
| Eating out / takeaways | £5.84 | £5.87 | £12.13 | £13.26 | £10.96 |
| 2020 | 2021 | 2022 | 2023 | 2024 | |
|---|---|---|---|---|---|
| Food prepared at home | £67.65 | £67.33 | £80.34 | £95.87 | £108.87 |
| Eating out / takeaways | £7.87 | £7.92 | £16.01 | £17.50 | £15.79 |
| 2020 | 2021 | 2022 | 2023 | 2024 | |
|---|---|---|---|---|---|
| Food prepared at home | £74.48 | £74.13 | £79.39 | £94.73 | £131.19 |
| Eating out / takeaways | £7.26 | £7.30 | £9.59 | £10.48 | £12.78 |
| 2020 | 2021 | 2022 | 2023 | 2024 | |
|---|---|---|---|---|---|
| Food prepared at home | £104.08 | £103.58 | £110.81 | £132.23 | £184.68 |
| Eating out / takeaways | £8.31 | £8.36 | £11.56 | £12.63 | £14.27 |
Note: Food prepared at home excludes alcohol consumed within the home.
For households with children, there has been a substantial increase in the food budget since 2023. This is partly a product of an increase in the amounts included for eating out and takeaways, and also reflects a change in how the food budgets within MIS are constructed. For the lone-parent household, the budget for eating out has increased from £50 4 times a year in 2020, to £65 4 times a year in 2024. In addition, groups included £20 a month for the lone parent to eat out without their children. For the couple-parent household, the budget for eating out has increased from £75 every 3 months in 2020 to £105 every 3 months in 2024. The amount included for additional food and drink for celebrations such as Christmas has also increased since 2020, up from £80 to £200 a year per household in 2024. While these changes have increased the weekly food budget, the change in how MIS food budgets are constructed is of far greater consequence. This change follows the revision to the approach to food introduced for households without children in 2022 (Davis et al., 2022). This year we adopted the same approach to constructing MIS food baskets, which takes into account increases in the weight of the UK population as a whole, and uses updated figures for average weight and height for men and women. As in 2022, the consequence of this is that the required calorie intake for adequate nutrition is higher than in previous MIS calculations, resulting in a greater number of items in the weekly food basket than in preceding years. As of 2024, all of the food baskets included in MIS budgets have been constructed using these new values.
The change in methodology has produced a substantial increase in the cost of a weekly food shop for households with children, which is far greater than the increase in the cost of food as tracked through the Consumer Prices Index (CPI). Between April 2023 and April 2024, the price of food rose by 2.9% (Office for National Statistics, 2024a); weekly food budgets for households with children within MIS have increased by around 40% since 2023. When this change in methodology was introduced in 2022 for households without children, this resulted in an increase of 30% in the cost of a weekly food shop. While this is a substantial increase in the amount included for food prepared at home, the food element of a minimum budget continues to account for around a quarter of what is needed for a minimum, socially acceptable standard of living, across households.
All working-age households have seen substantial increases in the budget for personal goods and services in 2024. Key changes introduced this year have driven these increases. First, there have been increases in the budgets included for hairdressing and haircare, in order to acknowledge and better reflect the diversity of hair needs and include amounts that are more inclusive than in previous MIS research. Second, the inclusion of an additional healthcare budget of £200 a year per working-age adult or parent has also increased this element of the MIS basket. As discussed in Chapter 3, this amount was included in recognition of the current difficulties in accessing services such as physiotherapy or counselling in a timely fashion via the NHS.
All households have seen changes in the budgets for social and cultural participation; for working-age adults without children and pensioners, these have decreased since 2023, while households with children have seen an increase. As outlined in Chapter 3, working-age adults without children did not include an additional TV streaming service such as Netflix, which had been included in the MIS budgets in 2022. There was also a reduction in the amount included for social activities each week, from £30 in 2022 to £25 in 2024, and a substantial reduction in holiday spending money. In combination, these changes have resulted in an overall reduction of £9.56 a week in this budget element for single working-age adults.
For households with children, the increase in the social and cultural participation budgets is a combination of changes in what has been specified as needed for a minimum standard of living and increases in prices over time. The increase is not driven by one particular item, but by a number of changes in the specification of minimum needs and how these are met, as well as changes in the cost of services and the price of items. For example, the annual cost of a one-week holiday, self-catering in the UK, for the lone-parent and couple-parent households included here, has increased from £1,056 in 2023 to £1,379 in 2024. Groups also increased the amount needed to enable a primary school child to undertake 2 leisure activities each week, such as swimming or a team sport; this is £820 a year (around £16 a week) in 2024.
5. How MIS compares with incomes on benefits and the National Living Wage
The previous chapters have provided a detailed account of what the general public agree is needed for households to have a socially acceptable standard of living, and how this translates into a weekly income requirement. However, for many households, this benchmark remains out of reach (Padley et al., 2024). In this chapter, we compare needs (as represented by MIS budgets) to the disposable incomes that people actually receive from benefits and/or earning the National Living Wage (NLW). Disposable incomes are defined as the amount that households have left to spend after paying taxes (including Council Tax), rent and childcare costs. All comparisons exclude the temporary cost of living payments that were provided to low-income households in 2023.
In 2024, there have been a number of economic and policy changes that potentially affect the financial circumstances of low-income households. Inflation has been steadily decreasing, with the Consumer Prices Index (CPI) falling from 8.7% in April 2023 to 2.3% in April 2024 (Office for National Statistics, 2024a). However, although inflation has eased, the cumulative impact of rapid price rises during 2022 and 2023 means that household budgets remain stretched.
The cost of living payments designed to offset some of the impact of this increase in prices, which the Government provided to those in receipt of means-tested benefits in 2023, have now ended. However, even with these additional payments of at least £900 a year, many households would have struggled to meet MIS (Padley and Stone, 2023), and without this extra income they risk falling even further below the benchmark for a dignified living standard.
At the same time, some recent changes have potentially had a positive impact on household incomes. The cash value of most working-age benefits was increased in April 2024, with the amounts uprated by 6.7%, based on the Consumer Prices Index in September 2023 (Kirk-Wade and Harker, 2023). Despite the welcome return to the uprating of benefits based on inflation, which was reinstated in 2020, the use of previous September 2023 inflation rates to increase benefits in April 2024 during a period of rising inflation meant the long period during which benefits were either frozen or uprated at a level below current inflation was inadvertently extended. This increase is not, therefore, in any way sufficient to bring the rate of benefits into line with the rise in living costs. Furthermore, many out-of-work households will fail to see any increase in their income following the uprating because the benefit cap limits their total entitlement. After being uprated in line with inflation in 2023, the benefit cap has been frozen again and has not increased in 2024.
For working households, the National Living Wage increased by 9.8% in 2024, rising from £10.42 to £11.44 an hour for people aged 21 and older. People in work have also benefited from a reduction in the rate of National Insurance Contributions to 8%, from 10% in January 2024 and 12% in April 2023. However, the amount that people gain is not substantial, particularly if they are on a low income. Someone working full-time on the National Living Wage would gain less than £4 a week from the latest National Insurance Contribution cut, while someone earning £50,000 a year would gain just over £14 a week. For those on very low incomes who are earning less than the National Insurance threshold of £12,570 a year, there will be no change in their net income.
Working parents may also benefit from existing and planned changes to the support provided to working families to pay for childcare. From April 2024, working parents of 2-year-olds are now able to access 15 hours a week of free childcare during school term time, supplementing the 30 hours already available for 3- and 4-year-olds. This is due to be extended further in September 2024 to cover children from the age of 9 months, with the expectation that by September 2025, all eligible working parents of children from 9 months to school age will be entitled to 30 hours of childcare a week during term time.
For those living in private rented housing, changes to the Local Housing Allowance may also have had a positive impact on their disposable income. For the first time in 4 years, Local Housing Allowance rates were increased in April 2024, and were recalibrated to the 30th percentile of local rents. For those receiving Housing Benefit, this means that their eligible rent will now be closer to reflecting the actual costs of private rented housing. However, particularly for those living in areas with high housing costs, this may not translate into any real gain if their income is limited by the benefit cap.
Working-age adults without children
Figures 6 and 7 show how the disposable income of working-age adults without children changes based on their benefit entitlement and level of employment, and how this compares to what they need to reach MIS. The inadequacy of out-of-work benefits is starkly apparent, with both singles and couples in non-working households falling far short of MIS, at just 28% and 27% of what singles and couples need, respectively. For single people, while moving into paid employment has a marked and positive impact on their disposable income, they are still falling more than 20% short of the MIS benchmark even if working full-time (defined as working 37.5 hours a week) on the National Living Wage. For couples, the situation is better, and if both are working full-time, their income exceeds the MIS threshold by 15%. Of the household types described in this chapter, this is the only one where their income from paid employment reaches MIS.
The income gains from working have increased since last year. In 2023, a single working-age adult working full-time on the National Living Wage could reach 67% of MIS; in 2024 this has risen to 77%. Couples both working full-time on the National Living Wage were at 100% of MIS (£1 above) in 2023, but are now more comfortably above that line, at 115% of MIS. This change is driven in large part by the increase in the National Living Wage, which for the past 2 years has been above the rate of inflation. The National Living Wage is the highest it has ever been relative to median wages (Low Pay Commission, 2024), and is moving closer to meeting the target of being equivalent to two-thirds of median pay by October 2024. The fact that this has had such a notable impact on the ability of households to reach MIS highlights the importance of continuing to monitor and adequately uprate the National Living Wage, to make sure that the earnings of low-income households do not lag behind those of the population as whole.
Also underlying the increase in incomes relative to MIS is the fact that the gross income that these households need to reach MIS has fallen slightly since 2023. In 2023, a single, working-age adult needed £29,500 a year to have enough disposable income to reach MIS; in 2024, this has fallen to £28,000. A couple without children, both working, needed to earn £40,600 a year between them (an average of £20,300 each) in 2023 to reach MIS, but in 2024 they need a gross income of £39,400 a year. These reduced income requirements are explained in part by the slight reduction in the overall MIS budgets for households without children this year, as described in previous chapters. These households have also benefited from the 4 percentage-point reduction in the rate of National Insurance Contributions since April 2023, meaning that the gross income required to achieve an adequate net income has fallen. Nevertheless, working full-time on the National Living Wage would only allow a single working-age adult to earn £22,369 a year, which still falls markedly short of the income needed for a socially acceptable standard of living in 2024.
For those on out-of-work benefits, the situation is even less encouraging. These households have seen only a marginal improvement in their incomes relative to MIS since last year, when both single and couple households on out-of-work benefits reached 24% of MIS, compared with 28% for singles and 27% for couples in 2024. This small improvement is again in part due to the slight reduction in the MIS budget for these households since 2023, combined with the uprating of benefits. However, it remains clear that out-of-work benefits are still falling far short of what is needed to live with dignity.
Households with children
The insufficiency of out-of-work benefits is again apparent when looking at households with dependent children. Figures 8 and 9 set out the disposable income that lone- and couple-parent households with 2 children aged 3 and 7 have through different working patterns on the National Living Wage. Households where nobody is in work have less than half what is needed for a socially acceptable standard of living, and this situation has got worse since last year’s report.
In 2023, a lone parent on out-of-work benefits with 2 children reached 49% of MIS, but this has fallen to 44% in 2024, with a weekly shortfall of nearly £350. Working full-time on the National Living Wage, they now only achieve 69% of MIS, compared with 76% in 2023. Households with children, especially lone-parent households, will gain less income through moving into full-time work than those without children, because they are not only affected by the reduction in Universal Credit as earnings rise, but will also need to cover the costs of childcare. Although Universal Credit pays up to 85% of childcare costs, this still leaves a shortfall that must be met from the parents’ earnings, and in some cases childcare support will be further limited by the cap on eligible childcare costs, of £1,015 a month for one child or £1,740 a month for more than one child. In 2024, to afford a minimum socially acceptable standard of living, including contributing to the cost of childcare, a lone parent with 2 children, working full-time, would need to earn £57,000 a year.
For couple parents with 2 children, their disposable income falls £471 short of the MIS threshold every week if they are not working, representing just 39% of the income required to meet MIS – down from 48% in 2023. Even when both parents are in full-time work, they are not able to meet the MIS threshold (82% of MIS), and to fully meet what they need for a socially acceptable standard of living, they would need to earn £69,400 a year between them.
Even when working full-time and with the additional support from Universal Credit, Child Benefit and help with childcare costs, households with children continue to fall short of reaching MIS. Moreover, in these examples we focus on households with 2 children; for larger families, the situation is likely to be even more stark due to the restrictions on Universal Credit via the ‘2-child limit’ (whereby recipients do not get any extra Universal Credit when they have 3 or more children).
The calculations for households with children described above assume that these families are living in social housing, as agreed in discussions with groups of members of the public about meeting housing needs at a minimum (see Chapter 3). However, in 2024, many households with children will be reliant on private rented housing. In 2022/23, an estimated 22% of households with children were living in private rented housing, compared with 20% in the social rented sector (Department for Levelling Up, Housing and Communities, 2023), and private rents are likely to be more costly than social housing. An out-of-work couple with 2 children aged 3 and 7 living in social rented housing would have their rent paid in full by the housing element of Universal Credit. Therefore, rent would have no impact on their disposable income, leaving them with £306 a week. If they were living in the private rental sector2 and paying a lower-quartile rent of £156 a week (compared with £117 a week in social housing), they would hit the benefit cap of £423 a week, and would have to cover the shortfall in rent of £39 a week, leaving them with only £267 a week (34% of MIS).
Pensioners
In 2024, the State Pension provides pensioners with an income that is closer to the MIS threshold than working-age benefits do for younger households. Figure 10 shows that a single pensioner can reach 94% of the income required for a socially acceptable standard of living, whether receiving the full State Pension, or receiving a top-up via Pension Credit. This is an improvement on 2023, when single pensioners were only reaching 80% of MIS via the State Pension or Pension Credit. As for working-age households without children, this improvement in part reflects the changes in the basket of goods and services that pensioners need in 2024. However, it also demonstrates how the ‘triple lock’ continues to protect pensioners against the rising cost of living. While working-age benefits were uprated by 6.7% in April 2024 based on the Consumer Prices Index, the State Pension was uprated by 8.5% in line with growth in earnings, as this was higher than both inflation and 2.5%.
Similarly, couple pensioners have seen their incomes move closer to the MIS benchmark (see Figure 11) – from 77% in 2023 to 87% in 2024 for those on Pension Credit, and from 81% to 91% for those receiving the full State Pension.
A single pensioner living alone would need an income of £17,200 a year to reach MIS, and couple pensioners would need £27,800 (£13,900 each) for a socially acceptable standard of living. In 2024, the full State Pension now amounts to £11,534 a year (Department for Work and Pensions, 2024), which when combined with a small additional amount from the Winter Fuel Payment, allows pensioners to reach 94% of MIS. However, the net income needed to reach MIS is much higher due to interaction between the State Pension and means-tested benefits. As incomes increase above the State Pension level, via private pensions or earned income, eligibility for means-tested benefits reduces, so pensioners with incomes sufficient to reach MIS would need to cover a greater proportion of their housing costs, for example.
6. Conclusion
Since MIS was first established in 2008, it has provided a publicly agreed, regularly updated, grounded description of what a minimum socially acceptable standard of living should look like in contemporary society. While there have been changes in a minimum basket of goods and services, much of what people identify as being required to reach a minimum living standard has remained broadly similar over the past decade and a half. Some of this is about meeting ‘core’ needs – being sure of having sufficient, nutritious food as a household; being sure of having a roof over your head; and being able to afford to heat your home. But the minimum is about more than just meeting these needs. The groups of people at the heart of MIS research have always been clear that a minimum standard of living means being able to take part in the world around you, not feeling excluded: being able to buy your child a birthday present; being able to access employment and social activities; and eating out occasionally with friends or family. In combination, these clearly articulated needs set out a vision of what is needed to enable people to live with dignity.
And yet in 2024, meeting this minimum standard of living remains a challenge for many households. Households across the UK continue to feel increases in the cost of living. A survey tracking financial wellbeing in the UK reported that just over a quarter (26%) of UK households felt financially ‘secure’ (Evans and Collard, 2023). In the same study, more than ever, households reported using their heating less, using cooking appliances less often, and taking fewer baths and showers to reduce energy bills. Trussell (2024) statistics show that from April 2023 to March 2024, food banks in its network had provided more than 3.1 million emergency food parcels, an increase of 94% since 2018/19. The unaffordability of transport has been highlighted too and linked with rising government pricing caps and deregulated and privatised public transport services (Martiskainen et al., 2023). Rising prices and inadequate incomes mean that ‘cutting back’ has, for many, become ‘the new normal’ (Evans and Collard, 2023, p. 1).
In recent years, household incomes have not kept pace with the increasing cost of living. We have seen people in employment making up an increasing share of the population who lack the income needed to meet their needs. Around two-thirds of working-age adults living in poverty are from households where someone is in work (Joseph Rowntree Foundation, 2024a, p. 11); in 2021/22, 45.6% of households with incomes below MIS were those where all adults were employed (Padley et al., 2024). Growing income insecurity, where incomes are not only inadequate but also unpredictable (Young, 2024; International Labour Organization, 2016), further compounds this problem, and the widening gap between everyday costs and income has become a key factor in the recourse to personal debt. In a study of indebtedness among people in full-time employment, the rising cost of living was the top reason (26% of all answers) given for debt (StepChange, 2024). This points to a shift in the nature and causes of indebtedness (Dagdeviren et al., 2019, p. 160), with debt being taken on to cover food, energy and rent costs rather than ‘to accumulate assets’. Further, debt repayments, often taken on to cover these everyday costs, can be a key factor in pushing incomes below MIS, thereby adversely affecting living standards (Christians Against Poverty, 2024; Joseph Rowntree Foundation, 2024b; Stone et al., 2024).
Against this bleak backdrop, the standard of living that MIS sets out – and the income needed to reach this level – can appear aspirational, or unrealistically idealistic. But members of the public remain clear that a minimum socially acceptable living standard means being able to meet material needs like food, clothes and shelter without struggle. It should also support wellbeing, not only through people being able to access services to support and maintain their physical health, but also having the resources to take a break from everyday life for an outing or holiday. Rather than setting out to describe life at a minimum, it paints a picture of what society agrees life should be like for everyone, as a minimum.
There is much scope for the current situation to improve. This could be achieved through greater investment in public services, the provision of subsidised or universal services, increases in pay and benefit levels, greater availability of genuinely affordable housing or a combination of any of these and other measures. MIS provides a benchmark that will enable us to monitor changes and (hopefully) future progress towards a society in which we can all live with dignity.
Notes
- Menus for single men and women are devised separately and the single budget totals are based on an average of the 2. This is based on the idea that, although some budget elements might be higher for men than for women, they are largely the same and the differences are likely to cancel each other out.
- Calculations are based on average rents in the East Midlands region of England.
Annex: MIS in brief
What is MIS?
The Minimum Income Standard (MIS) is the income that people need to reach a minimum socially acceptable standard of living in the UK today, based on what members of the public think. It is calculated by specifying baskets of goods and services required by different types of household to meet these needs and to participate in society. Based on consultation with groups of members of the public in the original research, this minimum is defined as follows:
A minimum standard of living in the UK today includes, but is more than just, food, clothes and shelter. It is about having what you need in order to have the opportunities and choices necessary to participate in society.
How is MIS arrived at?
Members of the public have detailed negotiations, in groups, about the things a household needs to achieve an acceptable living standard. Each sequence of groups has a different role. The first set of groups go through all aspects of household budgets, identifying what goods and services would be needed, of what quality, how long they would last and where they would be bought. Experts make selective inputs, notably checking the nutritional adequacy of the food baskets, calculating domestic fuel requirements and advising on motoring costs where relevant. Subsequent groups check and amend the budget lists, which the research team then price at various stores and suppliers.
Groups typically comprise 6 to 8 people from a range of socioeconomic and ethnic backgrounds, but all participants within each group are from the household category under discussion. So, parents with dependent children discuss the needs of parents and children, working-age adults without children discuss the needs of single and coupled working-age adults without children, and pensioner groups decide the minimum for pensioners. In all, more than 160 groups, involving new participants on each occasion, have taken part in the MIS research since it began in 2008.
A crucial aspect of MIS is its method of developing a negotiated consensus among these socially mixed groups. This process is described in detail in Davis et al. (2015). The MIS approach uses a method of projection, whereby group members are asked not to think of their own needs, but of those of hypothetical individuals (or case studies). Participants are asked first to imagine walking around the home of the individuals under discussion, to develop a picture of how they would live, to reach the living standard defined above, before considering needs outside of the home. While participants do not always start with identical ideas about what is needed for a minimum socially acceptable standard of living, through detailed discussion and negotiation they commonly converge on answers that the group as a whole can agree on. Where this does not appear to be possible, for example where there are 2 distinct arguments for and against the inclusion or exclusion of an item, or where a group does not seem able to reach a conclusion, subsequent groups help to resolve differences.
What does MIS include?
As set out in the definition above, a minimum standard of living is about more than survival alone. However, it covers needs, not wants; and necessities, not luxuries – items that the public think people need in order to be part of society. In identifying things that everyone requires as a minimum, it does not attempt to specify extra requirements for particular individuals and groups who may have additional needs – for example, those resulting from living in a remote location or having a disability. So, not everybody who has more than the minimum income can be guaranteed to achieve an acceptable living standard. But someone falling below the minimum is unlikely to achieve such a standard.
How can I access the results?
There are several ways of accessing MIS results for different users, all via the Centre for Research in Social Policy website:
- The online Minimum Income Calculator shows the budgets and earnings requirements for any specified household type.
- There are lists of the items used to compile the budgets for each household type.
- For users who want to analyse the data, there are spreadsheets showing the budgets broken down by category for each of the main household types for each year of MIS.
- There is also an Excel version of the current year calculator, which can generate results for any specified household type for the present year.
- There is an Excel version of the charts and tables from this report.
Who does it apply to?
MIS applies to households that comprise a single adult or a couple, with or without dependent children. It covers most such households, with its level adjusted to reflect their composition. The needs of more than 100 different family combinations (according to numbers and ages of family members) can be calculated. MIS does not cover families living with other adults in the main calculations, although supplementary reports on single adults sharing accommodation (Hill et al., 2015) and single adults in their 20s living with their parents (Hill and Hirsch, 2019) estimate variations for these household types.
Where does it apply?
MIS was originally calculated as a minimum for Britain; subsequent research in Northern Ireland in 2009 showed that the required budgets there were all close to those in the rest of the UK, so the national budget standard now applies to the whole of the UK. This main UK standard is calculated based on the needs of people in urban areas outside London. Between 2008 and 2020, most discussion groups were held in towns and cities in the Midlands, but since 2018, budgets have been reviewed in other parts of the UK. In 2022, as all MIS groups were held online, we were able to expand the geographical spread of groups, and held them with participants from towns and cities around the UK.
The research has also been applied in other geographical contexts, in supplementary projects considering costs in rural England (Smith et al., 2010), in London (Padley et al., 2023), in remote rural Scotland (Hirsch et al., 2013) and in Guernsey (Smith et al., 2011). Further research is ongoing in remote rural Scotland as part of the Scottish Government’s monitoring of fuel poverty. The London research is also ongoing, and Inner and Outer London budgets are shown as a variation of the main UK results in the online Minimum Income Calculator. Other countries have used the same overall method, but employed their own definitions of the minimum. There have been studies in France (Gilles et al., 2014), Portugal, Japan (Davis et al., 2013), Singapore (Ng et al., 2023), Thailand, Tunisia and Mexico (Aban Tamayo et al., 2020). An ongoing MIS programme in the Republic of Ireland uses methods based on the UK work (Collins et al., 2012). And pilot research has been carried out in South Africa (Byaruhanga et al., 2017).
How is it related to the poverty line?
MIS is relevant to the discussion of poverty, but does not claim to be a poverty threshold. This is because participants in the research were not asked to talk about what defines poverty, but instead what, in today’s society, constitutes an acceptable minimum. However, it is relevant to the poverty debate in that almost all households officially defined as being in income poverty (having below 60% of median income) are also below MIS. Thus, households classified as being in relative income poverty are generally unable to reach an acceptable standard of living as defined by members of the public.
Who produces it?
The main MIS research is supported by the Joseph Rowntree Foundation (JRF) and carried out by the Centre for Research in Social Policy (CRSP) at Loughborough University. The original research in 2008 was developed by CRSP in partnership with the Family Budget Unit (FBU) at the University of York.
References
Aban Tamayo, J. Becerra Perez, M. Delajara, M. Robles, L. (2020) El Estándar de Ingreso Mínimo dn Cuatro Grandes Ciudades de México [The Minimum Income Standard in four large cities in Mexico]
BBC News (2024) Netflix password crackdown fuels sign-up surge
Byaruhanga, C. Davis, A. Mpike, M. Ntshongwana, P. Padley, M. Wright, G. Zembe-Mkabile, W. (2017) A decent living level: a pilot of the Minimum Income Standard approach in South Africa
Centre for Sustainable Energy (2022) Room heaters
Christians Against Poverty (2024) Pushed under, pushed out: the link between debt, poverty and living standards
Collins, M.L. MacMahon, B. Weld, G. Thornton, R. (2012) A Minimum Income Standard for Ireland: a consensual budget standards study examining household types across the lifecycle
Dagdeviren, H. Balasuriya, J. Luz, S. Malik, A. Shah, H. (2019) Financialisation, welfare retrenchment and subsistence debt in Britain
Davis, A. Hirsch, D. Iwanaga, R. Iwata, M. Shigekawa, J. Uzuki, Y. Yamada, A. (2013) Comparing the Minimum Income Standard in the UK and Japan: methodology and outcome
Davis, A. Hirsch, D. Padley, M. Marshall, L. (2015) How much is enough? Reaching social consensus on minimum household needs
Davis, A. Hirsch, D. Padley, M. Shepherd, C. (2018) A Minimum Income Standard for the UK, 2008–2018: continuity and change
Davis, A. Stone, J. Blackwell, C. Padley, M. Shepherd, C. Hirsch, D. (2022) A Minimum Income Standard for the UK in 2022
Department for Education (2021) Cost of school uniforms
Department for Energy Security and Net Zero (2024a) DESNZ Public Attitudes Tracker: heat and energy in the home, winter 2023, UK
Department for Energy Security and Net Zero (2024b) Annual fuel poverty statistics in England, 2024 (2023 data)
Department for Levelling Up, Housing and Communities (2022) English Housing Survey 2021 to 2022: headline report
Department for Levelling Up, Housing and Communities (2023) English Housing Survey 2022 to 2023: Annex Table 1.5
Department for Levelling Up, Housing and Communities. Department of Health and Social Care. UK Health Security Agency (2023) Understanding and addressing the health risks of damp and mould in the home
Department for Transport (2022) Transport statistics Great Britain: 2022 domestic travel
Department for Work and Pensions (2024)Benefit and pension rates 2024 to 2025
Drayton, E. Farquharson, C. Ogden, K. Sibieta, L. Tahir, I. Waltmann, B. (2023) Schools serving disadvantaged children have faced the biggest spending cuts
Evans, J. Collard, S. (2023) The ‘new normal’? The financial wellbeing of UK households in May 2023: findings from the 8th Financial Fairness Tracker Survey
Exworthy, M. Mannion, R. Powell, M. (eds) (2023) The NHS at 75: the state of UK health policy
Gabert-Doyon, J. Quinio, A. (2024) ‘I don’t have a choice’: UK patients turn to medical loans for treatment costs
Gilles, L. Covolao, C. Concialdi, P. Math, A. (2014) Study conducted at the request of the French National Observatory on Poverty and Social Exclusion (ONPES) – final report, Paris: CREDOC
Green, R. Agerholm, H. Rogers, L. (2022) Full extent of NHS dentistry shortage revealed by far-reaching BBC research
Hill, K. Hirsch, D. (2019) Family sharing – a Minimum Income Standard for people in their 20s living with parents
Hill, K. Hirsch, D. Padley, M. (2015) Minimum budgets for single people sharing accommodation
Hirsch, D. Bryan, A. Davis, A. Smith, N. Ellen, J. Padley, M. (2013) A Minimum Income Standard for remote rural Scotland
International Labour Organization (2016) Non-standard employment around the world: understanding challenges, shaping prospects
Johnston, N. Uberoi, E. (2023) Voter ID
Joseph Rowntree Foundation (2024a) UK poverty 2024: the essential guide to understanding poverty in the UK
Joseph Rowntree Foundation (2024b) The scale of the challenge: JRF’s pre-election cost of living tracker
Kirk-Wade, E. Harker, R. (2023) Benefits uprating 2024/25
Low Pay Commission (2024) National Minimum Wage: Low Pay Commission report 2023
Marmot, M. (2024) The next government must put health at the heart of all policies
Martiskainen, M. Hopkins, D. Torres Contreras, G.A. Jenkins, K.E.H. Mattioli, G. Simcock, N. Lacey-Barnacle M. (2023) Eating, heating or taking the bus? Lived experiences at the intersection of energy and transport poverty
Monro, S. (2024) Heat the human not the home
Montacute, R. (2023) The cost of living crisis hits school spending
Ng, K.H. Wong, Y.L. Teo, Y.Y. Neo, Y.W. Maulod, A. Chok, S. (2023) Minimum Income Standard 2023: household budgets in a time of rising costs
Office for National Statistics (2023) Travel to work by method and distance
Office for National Statistics (2024a) Consumer price inflation, UK: April 2024
Office for National Statistics (2024b) Private rent and house prices, UK: May 2024
Office of Rail and Road (2023) Rail fares index 2023
Omer, N. (2023) Wednesday briefing: why you can’t find an NHS dentist in England
Padley, M. Davis, A. Blackwell, C. Shepherd, C. Stone, J. (2023) A Minimum Income Standard for London 2022
Padley, M. Stone, J. (2023) A Minimum Income Standard for the United Kingdom in 2023
Padley, M. Stone, J. Robinson, E. (2024) Households living below a Minimum Income Standard: 2008–2022
Shelter (2024a) No-fault bailiff evictions soar to six year high
Shelter (2024b) Loss of social housing
Smith, N. Davis, A. Hirsch, D. (2010) A Minimum Income Standard for rural households
Smith, N. Davis, A. Hirsch, D. (2011) A Minimum Income Standard for Guernsey
StepChange (2024) In work. But still in debt
Stone, J. Robinson, E. Blackwell, C. Padley, M. (2024) Debt, poverty and living standards in Great Britain – research for Christians Against Poverty
Tapper, J. (2024) Shortage of NHS physio roles leaves patients in pain as waiting lists soar
Trussell (2024) Emergency food parcel distribution in the UK: 1 April 2023 to 31 March 2024
Thomas, D. (2023) Parents forgo holidays over school uniform costs
Topham, G. (2024) Rail fares to rise by 4.9% in England and Wales on Sunday
Transport Scotland (2023) Rail fares increase level confirmed
Walker, A. (2023) School uniform rules have limited impact, poll suggests
Young, D. (2024) Income insecurity and the relational coping strategies of low-income households in the UK
Acknowledgements
CRSP would like to thank all the participants who approached the decision-making process with diligence, open mindedness and good humour. MIS would not be possible without members of the public agreeing to take part and engaging with the research questions. Recruitment can be one of the most challenging aspects of social science fieldwork, and we are grateful to our long-term collaborators at Qa Research, particularly Helen Hardcastle and Natalie Hardcastle, for their assistance with this. Our expert contributors, Kathy Lewis, Kevin Jobson and Judith Paterson, also played an invaluable role in the 2024 research and reporting. We would also like to thank our colleagues, Nicola Lomax and Lisa Jones, who provided their usual outstanding administrative support and ensured that the project ran smoothly.
Lastly, we would like to thank the Joseph Rowntree Foundation for their partnership and collaboration over the years, and in particular Adél Schofield and Peter Matejic who have contributed to the work’s ongoing success.
About the authors
Professor Abigail Davis is Co-Director of the Centre for Research in Social Policy (CRSP). She leads the primary research for MIS and training for international teams in the MIS methodology.
Dr Chloe Blackwell is a Research Associate at CRSP. She carries out qualitative data collection and analysis for MIS and related projects. She currently leads on work to develop a minimum digital living standard for the UK.
Dr Wolf Ellis is a Research Associate at CRSP. He works on quantitative and qualitative elements of MIS and other projects, and has researched living standards and food security in a range of contexts in the UK and internationally.
Professor Matt Padley is Co-Director of CRSP, where he leads on data analysis and the application and development of MIS in London, the UK and globally. Matt has pioneered and leads research on Retirement Living Standards.
Dr Juliet Stone is Research Fellow at CRSP, where she focuses on quantitative analysis of income adequacy. She leads work on local child poverty indicators and poverty at the end of life.
Dr Eleanor Balchin is a Research Associate at CRSP, where she works across the MIS research.
How to cite this report
If you are using this document in your own writing, our preferred citation is:
Davis, A. Blackwell, C. Ellis, E. Padley, M. Stone, J. and Balchin, E. (2024) A Minimum Income Standard for the United Kingdom in 2024, York: Joseph Rowntree Foundation.